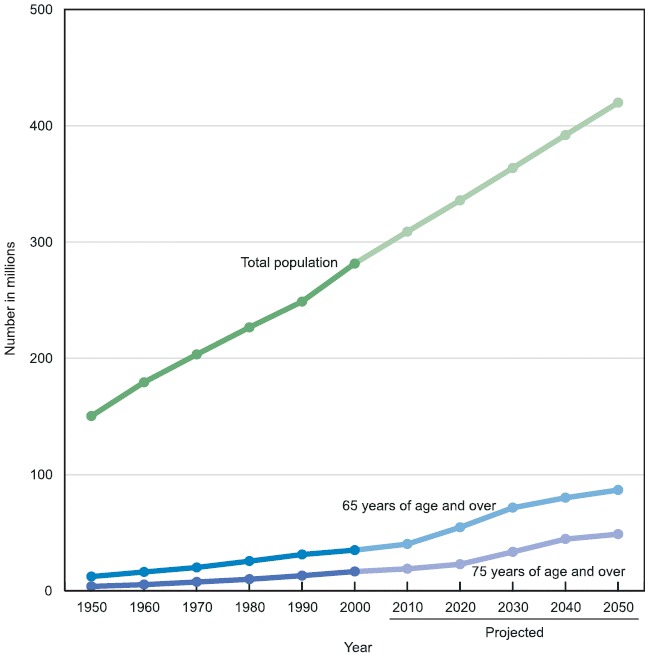
Figure 1. Total population, population 65 years and over and 75 years and over: United States, 1950–2050.

Figure 1Total population, population 65 years and over and 75 years and over: United States, 1950–2050

Click here for spreadsheet version Click here for PowerPoint

NOTES: See Data Table for data points graphed and additional notes.

SOURCE: U.S. Census Bureau, 1950–2000 decennial censuses and 2010–50 interim population projections.

From: Chartbook on Trends in the Health of Americans
Cover of Health, United States, 2004
Health, United States, 2004: With Chartbook on Trends in the Health of Americans.
National Center for Health Statistics (US) .
Hyattsville (MD): National Center for Health Statistics (US); 2004 Sep.

NCBI Bookshelf. A service of the National Library of Medicine, National Institutes of Health.