

NCBI Bookshelf. A service of the National Library of Medicine, National Institutes of Health.
Feingold KR, Anawalt B, Blackman MR, et al., editors. Endotext [Internet]. South Dartmouth (MA): MDText.com, Inc.; 2000-.

ABSTRACT
In this chapter we discuss a representative variety of methods currently available for estimating insulin sensitivity/resistance. These range from complex, time consuming, labor-intensive, invasive procedures to simple tests involving a single fasting blood sample. It is important to understand the physiological concepts informing each method so that relative merits and limitations of particular approaches are appropriately matched with proposed applications and data is interpreted correctly. The glucose clamp method is the reference standard for direct measurement of insulin sensitivity. Regarding simple surrogates, QUICKI and Log (HOMA) are among the best and most extensively validated. Dynamic tests are useful if information about both insulin secretion and insulin action are needed.
For complete coverage of all related areas of Endocrinology, please visit our on-line FREE web-text, WWW.ENDOTEXT.ORG.
INTRODUCTION
Insulin resistance plays a major pathophysiological role in type 2 diabetes and is tightly associated with major public health problems including obesity, hypertension, coronary artery disease, dyslipidemias, and a cluster of metabolic and cardiovascular abnormalities that define the metabolic syndrome (1, 2, 3).
A global epidemic of obesity is driving the increased incidence and prevalence of type 2 diabetes and its cardiovascular complications (4). Insulin resistance is commonly associated with visceral adiposity, glucose intolerance, hypertension, dyslipidemia, hypercoagulable state, endothelial dysfunction, and/or elevated markers of inflammation. Therefore, the presence of these clinical abnormalities is usually characteristic of an insulin resistant state. In addition to clinical manifestations of the “Insulin Resistance Syndrome”, insulin resistance predisposes to accelerated cardiovascular disease (CVD). Therefore, it is of great importance to develop tools for quantifying insulin sensitivity/resistance in humans that may be used to appropriately investigate the epidemiology, pathophysiological mechanisms, outcomes of therapeutic interventions, and clinical course of patients with insulin resistance (5). In this chapter, we will discuss some currently used methods for assessing insulin sensitivity, their applications, merits, and limitations.
INSULIN SENSITIVITY AND RESISTANCE
Metabolic actions of insulin help to maintain glucose homeostasis and promote glucose utilization (6). Insulin increases glucose utilization in peripheral organs (e.g., skeletal muscle and adipose tissue) and suppresses hepatic glucose production (HGP) and adipose tissue lipolysis. In addition to these classical metabolic target tissues, insulin has many other important physiological targets. These include the brain, pancreatic β-cells, heart, and vascular endothelium that help to coordinate and couple metabolic and cardiovascular homeostasis under healthy conditions (6-9). Insulin has concentration-dependent saturable actions to increase whole-body glucose disposal. The maximal effect of insulin defines “insulin responsiveness” while the insulin concentration required for a half-maximal response defines “insulin sensitivity” (Fig. 1). Although, other actions of insulin on fat and amino-acid metabolism, cardiovascular, kidney, and brain function also exhibit a concentration-dependent response, the term “insulin sensitivity” typically refers to insulin’s metabolic actions to promote glucose disposal.
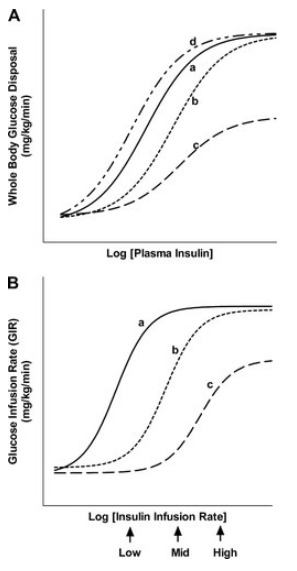
Figure 1.
Schematic representation of concentration-response relationships between plasma insulin concentrations and insulin-mediated whole-body glucose disposal. Curve a: normal insulin sensitivity and responsiveness. Curve b: rightward shift in insulin concentration-response curve. This represents decreased insulin sensitivity (increased EC50) with normal insulin responsiveness. Curve c: Decreased insulin sensitivity (increased EC50) and reduced insulin responsiveness. Curve d: Leftward shift in the insulin concentration-response response curve. This represents increased insulin sensitivity (decreased EC50) with normal insulin responsiveness.
The concept of insulin resistance was proposed as early as 1936 to describe diabetic patients requiring high doses of insulin (10). Insulin resistance is typically defined as decreased sensitivity and/or responsiveness to insulin-mediated glucose disposal and/or inhibition of HGP and adipose tissue lipolysis. Rigorous evaluation of altered sensitivity and responsiveness therefore requires a comparison of insulin dose-response curves.
DIRECT MEASURES OF INSULIN SENSITIVITY
Hyperinsulinemic Euglycemic Glucose Clamp
PROCEDURE
The glucose clamp technique, originally developed by Andres and DeFronzo is widely accepted as the reference standard for directly determining metabolic insulin sensitivity in humans (11). After an overnight fast, insulin is infused intravenously at a constant rate that may range from 5 - 120 mU/m2/min (dose per body surface area per minute). This constant insulin infusion results in a new steady-state insulin level that is above the fasting level (hyperinsulinemic). As a consequence, glucose disposal in skeletal muscle and adipose tissue is increased while HGP is suppressed. Under these conditions, a bedside glucose analyzer is used to frequently monitor blood glucose levels at 5 – 10 min intervals while 20% dextrose is given intravenously at a variable rate in order to “clamp” blood glucose concentrations in the normal range (euglycemic). An infusion of potassium phosphate is also given to prevent hypokalemia resulting from hyperinsulinemia and increased glucose disposal. After several hours of constant insulin infusion, steady-state conditions are typically achieved for plasma insulin, blood glucose, and the glucose infusion rate (GIR). Assuming that the hyperinsulinemic state is sufficient to completely suppress hepatic glucose production, and since there is no net change in blood glucose concentrations under steady-state clamp conditions, the GIR must be equal to the glucose disposal rate (M) (Fig. 2). Thus, whole body glucose disposal at a given level of hyperinsulinemia can be directly determined. M is typically normalized to body weight or fat-free mass to generate an estimate of insulin sensitivity. Alternatively, an insulin sensitivity index derived from clamp data can be defined as SIClamp = M/(G x ΔI), where M is normalized for G (steady-state blood glucose concentration) and ΔI (difference between fasting and steady-state plasma insulin concentrations) (12).
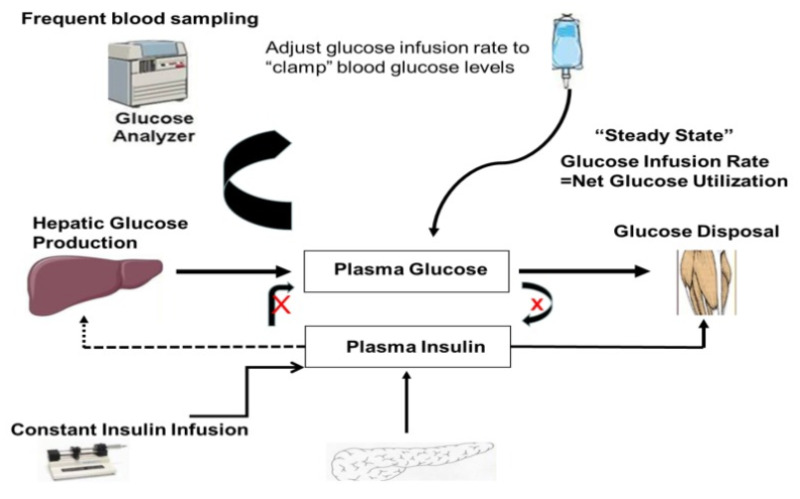
Figure 2.
Schematic representation of the “steady state” dynamics of glucose and insulin during an euglycemic hyperinsulinemic glucose clamp.
The validity of glucose clamp measurements of insulin sensitivity depends on achieving steady-state conditions. “Steady-state” is often defined as a period greater than 30-min (at least 1 h after initiation of insulin infusion) during which the coefficient of variation for blood glucose, plasma insulin, and GIR are less than 5% (12, 13). It is possible to use stable isotope or radio-labeled glucose tracer under clamp conditions to estimate HGP so that appropriate corrections can be made to M in the event HGP is not completely suppressed (14, 15, 16,17). An alternative approach is to use an insulin infusion rate sufficiently high to completely suppress HGP according to the insulin sensitivity/resistance of the population to be studied. M is routinely obtained at only a single insulin infusion rate and therefore comparisons between M or SIClamp among different subjects is valid only if the same insulin infusion rate is used for all subjects. When glucose tracers are used during a clamp study, the tracer is infused at constant rate throughout the study. HGP estimated during the last 20 or 30 min of the clamp is a measure of insulin-mediated suppression of HGP, an estimate of hepatic insulin sensitivity. Similarly, lipolytic rates can be assessed at baseline and hyperinsulinemia during clamp by using isotopic tracers (e.g., palmitate). A single or multistep hyperinsulinemic euglycemic clamp can be used to measure adipose tissue insulin sensitivity. The linear relationship between log transformed rates of palmitate flux and plasma insulin concentrations provides an IC50 (pmol/L) for suppression of lipolysis (18).
ADVANTAGES AND LIMITATIONS
The principal advantage of the glucose clamp in humans is that it directly measures whole body glucose disposal at a given level of insulinemia under steady-state conditions. Conceptually, the approach is straightforward and there are a limited number of assumptions which are clearly defined. In research settings where assessing insulin sensitivity/resistance is of primary interest and feasibility is not an issue (e.g., study population < 100) it is appropriate to use the reference standard glucose clamp technique. The main limitations of the clamp approach are that it is time-consuming, labor intensive, expensive, and requires an experienced operator to manage technical difficulties. Thus, for epidemiological studies, large clinical investigations, or routine clinical applications (e.g., following changes in insulin resistance after therapeutic intervention in individual patients) application of the glucose clamp is not feasible.
Insulin-Suppression Test (IST)
PROCEDURE
The insulin-suppression test, another method that directly measures metabolic insulin sensitivity/resistance, was introduced by Shen et. al. in 1970 and subsequently modified by Harano et. al. (19, 20). After an overnight fast, somatostatin (250 μg/h) or the somatostatin analogue octreotide (25 µg bolus, followed by 0.5 µg/min) (21) is intravenously infused to suppress endogenous secretion of insulin and glucagon. Simultaneously, insulin (25 mU/m2/min) and glucose (240 mg/m2/min) are infused into the same antecubital vein over 3 h. From the contralateral arm, blood samples for glucose and insulin determinations are taken every 30 min for 2.5 h and then at 10 min intervals from 150 - 180 min of the IST. The constant infusions of insulin and glucose determine steady-state plasma insulin (SSPI) and glucose (SSPG) concentrations. The steady-state period is assumed to be from 150 - 180 min after initiation of the IST. SSPI concentrations are generally (but not always) similar among subjects. Therefore, the SSPG concentration will be higher in insulin resistant subjects and lower in insulin sensitive subjects. That is, SSPG values are inversely related to insulin sensitivity. The IST provides a direct measure (SSPG) of the ability of exogenous insulin to mediate disposal of an intravenous glucose load under steady-state conditions where endogenous insulin secretion is suppressed.
ADVANTAGES AND LIMITATIONS
The SSPG is a highly reproducible direct measure of metabolic actions of insulin that is less labor-intensive and less technically demanding than the glucose clamp. Indeed, since there are no variable infusions with the IST, steady-state conditions are more easily achieved with the IST than with the glucose clamp. Estimates of insulin sensitivity determined by SSPG correlate well with reference standard glucose clamp estimates in normal subjects (r = 0.93) and in patients with type 2 diabetes mellitus (r = 0.91). (22, 23). Indeed, SSPG has positive predictive power for cardiovascular disease events and onset of type 2 diabetes (24, 25). In research settings where assessing insulin sensitivity/resistance is of primary interest and feasibility is not an issue, it is appropriate to use the IST. Moreover, the IST can be used for larger populations that may pose difficulties for application of the glucose clamp (26). Many of the limitations of the IST are similar to those described above for the glucose clamp (with the exception that the IST is less technically demanding). Thus, it is impractical to apply the IST in large epidemiological studies or in the clinical care setting. SSPG under ideal conditions determines primarily skeletal muscle insulin sensitivity and is not designed to reflect hepatic insulin sensitivity.
INDIRECT MEASURES OF INSULIN SENSITIVITY
Minimal Model Analysis of Frequently Sampled Intravenous Glucose Tolerance Test (FSIVGTT)
PROCEDURE
The minimal model, developed by Bergman, Cobelli and colleagues in 1979, provides an indirect measure of metabolic insulin sensitivity/resistance based on glucose and insulin data obtained during an FSIVGTT (27). After an overnight fast, an intravenous bolus of glucose (0.3 g/kg body weight) is infused over 2 min starting at time 0. Currently, a modified FSIVGTT is used where exogenous insulin (4 mU/kg/min) is also infused over 5 min beginning 20 min after the intravenous glucose bolus (28, 29,30). Some studies use tolbutamide instead of insulin in the modified FSIVGTT to stimulate endogenous insulin secretion (15, 29, 31, 32, 27). Blood samples are taken for plasma glucose and insulin measurements at -10, -1, 1, 2, 3, 4, 5, 6, 7, 8, 10, 12, 14, 16, 20, 22, 23, 24, 25, 27, 30, 40, 50, 60, 70, 80, 90, 100, 120, 160, and 180 min. These data are then subjected to minimal model analysis using the computer program MINMOD to generate an index of insulin sensitivity (SI).
The minimal model is defined by two coupled differential equations with four model parameters (Fig. 3). The first equation describes plasma glucose dynamics in a single compartment. The second equation describes insulin dynamics in a “remote compartment”. The structure of the minimal model allows MINMOD to uniquely identify model parameters that determine a best fit to glucose disappearance during the modified FSIVGTT. SI is calculated from two of these model parameters and is defined as fractional glucose disappearance per insulin concentration unit. In addition to SI, other minimal model parameters may be used to estimate a “glucose effectiveness” index (SG). SG is defined as the ability of glucose per se to promote its own disposal and inhibit HGP in the absence of an incremental insulin effect (i.e., when insulin is at basal or constant concentrations).
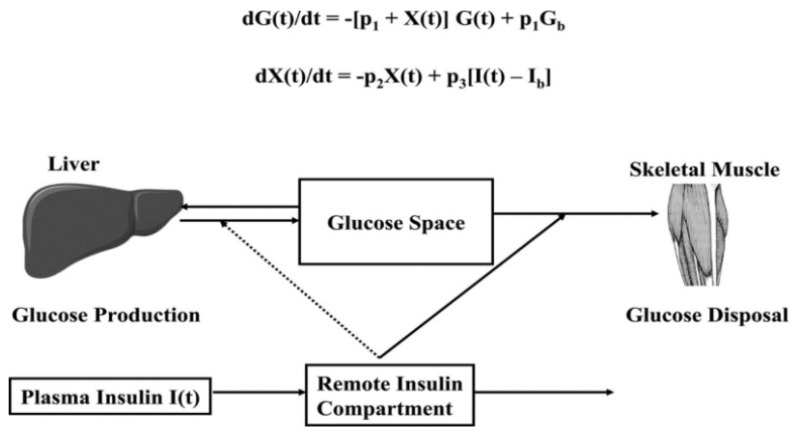
Figure 3.
Schematic, equations, and parameters for the minimal model of glucose metabolism. Differential equations describing glucose dynamics (G(t)) in a monocompartmental “glucose space” and insulin dynamics in a “remote compartment” (X(t)) are shown at the top. Glucose leaves or enters its space at a rate proportional to the difference between plasma glucose level, G(t) and the basal fasting level, Gb. In addition, glucose also disappears from its compartment at a rate proportional to insulin levels in the “remote” compartment (X(t)). In this model, t = time; G(t) = plasma glucose at time t; I(t) = plasma insulin concentration at time t; X(t) = insulin concentration in “remote” compartment at time t; Gb = basal plasma concentration; Ib = basal plasma insulin concentration; G(0) = G0 (assuming instantaneous mixing of the IV glucose load); p1, p2, p3, and G0 = unknown parameters in the model that are uniquely identifiable from FSIVGTT; glucose effectiveness, SG = p1; and insulin sensitivity, SI = p3/p2
Recently the minimal model has been used to assess free fatty acid (FFA) insulin sensitivity. Using a one compartment nonlinear model of FFA kinetics during FSIVGTT, showed that the FFA insulin sensitivity parameter correlated well with minimal model indices (33). Furthermore, this model also showed that glucose modulates disposal of FFAs.
ADVANTAGES AND LIMITATIONS
Minimal model analysis of the modified FSIVGTT is easier than the glucose clamp method because it is slightly less labor intensive, steady-state conditions are not required, and there are no intravenous infusions that require constant adjustment. Unlike the glucose clamp or IST, information about insulin sensitivity, glucose effectiveness, and β-cell function can be derived from a single dynamic test. The minimal model generates excellent predictions of glucose disappearance during the FSIVGTT. SI is a strong predictor of the development of diabetes in a prospective study of children of diabetic parents (34). Moreover, the insulin-modified FSIVGT may be used in relatively large-scale population studies (35). Therefore, in research settings where assessing insulin sensitivity along with glucose effectiveness and β-cell function is of interest, minimal model analysis of the insulin-modified FSIVGTT may be appropriate. The minimal model approach is simpler than direct methods for determining insulin sensitivity. Nevertheless, it still involves intravenous infusions with multiple blood sampling over a 3 h period that is nearly as labor intensive as the glucose clamp or IST. In addition, many limitations of minimal model analysis stem from the fact that the model oversimplifies the physiology of glucose homeostasis and is discussed in detail elsewhere (5).
Oral Glucose Tolerance Test (OGTT)
The oral glucose tolerance test (OGTT) is a simple test widely used in clinical practice to diagnose glucose intolerance and type 2 diabetes (36). After overnight fast, blood samples for determinations of glucose and insulin concentrations are taken at 0, 30, 60, and 120 min following a standard 75g oral glucose load. Oral glucose tolerance reflects the efficiency of the body to dispose of glucose after an oral glucose load or meal. The OGTT mimics the glucose and insulin dynamics of physiological conditions more closely than conditions of the glucose clamp, IST, or FSIVGTT. However, it is important to recognize that glucose tolerance and insulin sensitivity are not equivalent concepts. In addition to metabolic actions of insulin, insulin secretion, incretin effects, and other factors contribute importantly to glucose tolerance. Thus, the OGTT and meal tolerance tests provide useful information about glucose tolerance but not insulin sensitivity/resistance per se.
Intravenous and Oral Tracer Studies
The use of tracers for estimation of insulin sensitivity was first introduced in 1986 to overcome the shortcomings of FSIVGTT (37) The minimal model method does not allow segregation of glucose production from liver from exogenously administered glucose during calculations of insulin sensitivity and thus induces error in the insulin sensitivity calculations. Labeled intravenous glucose can be differentiated from endogenously produced glucose and thus use of labeled glucose during IVGTT provides more precise and accurate measurements (38,39) Similarly, labeled glucose has been used in oral glucose tolerance test and insulin sensitivity has been calculated by minimal model technique similar to FSIVGTT(40). There is a strong correlation of insulin sensitivity calculated from labeled oral minimal model with insulin sensitivity calculated from gold standard euglycemic hyperinsulinemic clamp, r=0.7, p<0.001 (41). There are dual tracer and triple tracer methods as well to estimate the hepatic/endogenous glucose production and discussion of these methods is beyond the scope of this review (42). Basal hepatic insulin resistance index can then be estimated as the product of HGP rate and the fasting plasma insulin concentration. Use of tracer definitely allows for improvement over the FSIVGTT. Use of labeled oral glucose allows for more precise measurements of insulin sensitivity and glucose disposal from a simple OGTT and this can be a useful tool in large studies. The triple tracer method is cumbersome and cannot be employed in large studies.
SIMPLE SURROGATE INDEXES FOR INSULIN SENSITIVITY/RESISTANCE
Surrogates Derived from Fasting Steady-state Conditions
After an overnight fast, a single blood sample is taken for determination of blood glucose and plasma insulin. In healthy humans, the fasting condition represents a basal steady-state where glucose is homeostatically maintained in the normal range such that insulin levels are not significantly changing and HGP is constant. That is, basal insulin secretion by pancreatic β cells determines a relatively constant level of insulinemia that will be lower or higher in accordance with insulin sensitivity/resistance such that HGP matches whole body glucose disposal under fasting conditions. Surrogate indexes based on fasting glucose and insulin concentrations reflect primarily hepatic insulin sensitivity/resistance. However, under most conditions, hepatic and skeletal muscle insulin sensitivity/resistance are proportional to each other. In the diabetic state with fasting hyperglycemia, fasting insulin levels are inappropriately low and insufficient to maintain euglycemia. Therefore, definitions of the more useful surrogate indexes take these considerations into account. Due to lack of a standardized insulin assay, it is not possible to use surrogate indexes to define universal cutoff points for insulin resistance.
ADVANTAGES AND LIMITATIONS
Simple surrogate indexes of insulin sensitivity/resistance are inexpensive quantitative tools that can be easily applied in almost every setting including epidemiological studies, large clinical trials, clinical research investigations, and clinical practice. If a direct measure of insulin sensitivity is not required, not feasible to obtain, or if insulin sensitivity is of secondary interest, it may be appropriate to use a surrogate index. The relative merits and limitations of individual surrogate indexes are discussed below.
The Homeostasis Model Assessment (HOMA)
HOMA, developed in 1985, is a model of interactions between glucose and insulin dynamics that is then used to predict fasting steady-state glucose and insulin concentrations for a wide range of possible combinations of insulin resistance and β-cell function (43). The model assumes a feedback loop between the liver and β-cell (43, 44, 45); glucose concentrations are regulated by insulin-dependent HGP while insulin levels depend on the pancreatic β-cell response to glucose concentrations. Thus, deficient β-cell function reflects a diminished response to glucose-stimulated insulin secretion. Likewise, insulin resistance is reflected by diminished suppressive effect of insulin on HGP. HOMA model describes this glucose-insulin homeostasis by a set of empirically derived non-linear equations. The model predicts fasting steady-state levels of plasma glucose and insulin for any given combination of pancreatic β-cell function and insulin sensitivity. Computer simulations have been used to generate a grid from which mathematical transformations of fasting glucose and insulin β-cell function (HOMA %B) from steady-state conditions. An important caveat for HOMA is that it imputes dynamic β-cell function (i.e., glucose-stimulated insulin secretion) from fasting steady-state data. In the absence of dynamic data, it is difficult, if not impossible, to determine the true dynamic function of β-cell insulin secretion.
In practical terms, most studies using HOMA employ an approximation described by a simple equation to determine a surrogate index of insulin resistance. This is defined by the product of the fasting glucose and fasting insulin divided by a constant. Thus, HOMA-IR = fasting insulin (μU/ml) × fasting glucose (mmol/l) / 22.5. The constant is a normalizing factor, the product of fasting plasma insulin of 5 µU/mL and plasma glucose of 4.5 mmol/L obtained from an “ideal” and “normal” individual. Therefore, for an individual with normal insulin sensitivity, HOMA-IR = 1. It is important to note that over wide ranges of insulin sensitivity/resistance Log (HOMA-IR), (which normalizes the skewed distribution of fasting insulin values) determines a much stronger linear correlation with glucose clamp estimates of insulin sensitivity (12). HOMA or Log (HOMA) is extensively used in large epidemiological studies, prospective clinical trials, and clinical research studies (45, 46, 47). In research settings where assessing insulin sensitivity/resistance is of secondary interest or feasibility issues preclude the use of direct measures by glucose clamp, it may be appropriate to use Log (HOMA-IR). However, as discussed below, other surrogate indexes have certain advantages over HOMA or Log (HOMA) in some circumstances.
Quantitative Insulin Sensitivity Check Index (QUICKI)
QUICKI is an empirically-derived mathematical transformation of fasting blood glucose and plasma insulin concentrations that provides a reliable, reproducible, and accurate index of insulin sensitivity with excellent positive predictive power (12, 48,13, 49, 50). Since fasting insulin levels have a non-normal skewed distribution, log transformation improves its linear correlation with SIclamp. However, as with 1/(fasting insulin) and the G/I ratio, this correlation is not maintained in diabetic subjects with fasting hyperglycemia and impaired β-cell function that is insufficient to maintain euglycemia. To accommodate these clinically important circumstances where fasting glucose is inappropriately high and insulin is inappropriately low, addition of log (fasting glucose) to log (fasting insulin) provides a reasonable correction such that the linear correlation with SIClamp is maintained in both diabetic and non-diabetic subjects. The reciprocal of this sum results in further transformation of the data generating an insulin sensitivity index that has a positive correlation with SIclamp. Thus, QUICKI = 1/Log (Fasting Insulin, µU/ml) + Log (Fasting Glucose, mg/dl). Over a wide range of insulin sensitivity/resistance, QUICKI has a substantially better linear correlation with SIclamp (r ≈ 0.8 – 0.9) than SI derived from the minimal model or HOMA-IR (12, 48, 49). Log (HOMA) is roughly comparable to QUICKI in this regard. Multiple independent studies find excellent linear correlations between QUICKI and glucose clamp estimates (either GIR or SIClamp) in healthy subjects, obesity, diabetes, hypertension, and many other insulin-resistant states (49, 51, 52, 53, 54, 55, 56). QUICKI is among the most thoroughly evaluated and validated surrogate index for insulin sensitivity. As a simple, useful, inexpensive, and minimally invasive surrogate for glucose clamp-derived measures of insulin sensitivity, QUICKI is appropriate and effective for use in large epidemiological or clinical research studies, to follow changes after therapeutic interventions, and for use in studies where evaluation of insulin sensitivity is not of primary interest.
Adipose Tissue Insulin Resistance Index (Adipo-IR)
Adipo-IR is a measure similar to HOMA-IR in that it is obtained from a fasting level of FFA and insulin (product of FFA and insulin levels). Recent studies have shown that Adipo-IR correlates well with the gold standard measure of adipose tissue insulin sensitivity derived from one-step hyperinsulinemic-euglycemic clamp technique using a palmitate tracer (57). Age and physical fitness were however shown to affect the predictive values. Thus, Adipo-IR may be suitable for larger population studies, however the multistep pancreatic clamp technique is probably needed for mechanistic studies of adipose tissue insulin action.
Surrogates Derived from Dynamic Tests
PROCEDURE
Surrogate indexes of insulin sensitivity that use information derived from dynamic tests include OGTT, meal tolerance tests, and IVGTT. Procedures for these tests have been described in a previous section. Specific indexes including Matsuda index (58), Stumvoll index (59), Avignon index (60), oral glucose insulin sensitivity index (OGSI) (61), Gutt index (62), and Belfiore index (63) use particular sampling protocols during the OGTT or the meal. In addition, minimal model approaches have been used to model plasma glucose and insulin dynamics during an OGTT or a meal to determine insulin sensitivity/resistance (64). Glucose disposal of an oral glucose load or a meal is mediated by a complex dynamic process that includes gut absorption, glucose effectiveness, neurohormonal actions, incretin actions, insulin secretion, and metabolic actions of insulin that primarily determine the balance between peripheral glucose utilization and HGP. Surrogate indexes that depend on dynamic testing take into account both fasting steady-state and dynamic post-glucose load plasma glucose and insulin levels. After an oral glucose challenge, the HGP is maximally suppressed for approximately 60 min and remains suppressed at a constant level for the subsequent 60–120 min time period. Therefore, glucose uptake by peripheral tissues (e.g., muscle and adipose tissue) primarily determines the rate of decrease in plasma glucose concentration from its peak value to its nadir during an OGTT. Based on this observation, surrogate indices of hepatic and muscle insulin sensitivity/ resistance from an OGTT has been widely used (65). Recent studies comparing the OGTT-derived, tissue-specific surrogate indices hepatic insulin resistance index (HIRI) and muscle insulin sensitivity index (MISI) with clamp measurements showed that surrogate indices derived from an OGTT are accurate in predicting insulin sensitivity, but are not tissue-specific (66). Studies using oral tracers in OGTT, with measurement of insulin sensitivity from OGTT and then comparing these to clamp measurements, would be crucial to ascertain the validity these measures. Indeed, recent studies have shown that it is possible to measure hepatic insulin sensitivity in healthy volunteers and in prediabetes with the use of single tracer (67).
ADVANTAGES AND LIMITATIONS
Many surrogate measures derived from dynamic data correlate reasonably well with glucose clamp estimates of insulin sensitivity (58, 61,62). Estimates of insulin sensitivity derived from OGTT predict the development of type 2 diabetes in epidemiologic studies ( 50, 68, 65). The advantage of surrogates based on dynamic testing is that information about insulin secretion can be obtained at the same time as information about insulin action. However, if one is only interested in estimating insulin sensitivity/resistance, fasting surrogates may be preferable to dynamic surrogates because they are simpler to obtain. The oral route of glucose delivery is more physiological than intravenous glucose infusion. However, poor reproducibility of the OGTT and meal tolerance test due to variable glucose absorption, splanchnic glucose uptake, and additional incretin effects need to be considered. Thus, distinguishing direct metabolic actions of insulin following oral ingestion of glucose or a mixed meal is more problematic than after FSIVGTT. In addition, as with many other measures of insulin sensitivity, surrogates derived from dynamic testing generally incorporate both peripheral and hepatic insulin sensitivity. Although OGTT involves considerably less work than FSIVGTT, dynamic testing in general requires more effort and cost than fasting blood sampling.
ETHNIC DIFFERENCES
Hispanics, African Americans, and South Asians are highly prone to develop diabetes. A meta-analysis showed that non-diabetic Africans have lower insulin sensitivity and higher insulin response after an intravenous glucose load compared to Caucasians and East Asians ( 69). In a study that compared euglycemic hyperinsulinemic clamp derived glucose disposal rates (GDR) with HOMA-IR, QUICKI, and OGTT-derived indices, fasting insulin levels and HOMA-IR did not correlate with GDR whereas Matsuda index derived from OGTT significantly correlated with GDR in African American men (70). Similarly, in another study in Afro-Caribbean adults, HOMA-IR did not correlate with insulin sensitivity calculated from FSIVGTT and M-value calculated from hyperinsulinemic euglycemic clamp (71). Likewise, IR predictive ability of QUICKI and HOMA-IR was limited in Asian-Indian men (72). Recent studies highlight that minimal model may underestimate insulin sensitivity between groups when acute insulin response (AIR) is higher in one group (73). African Americans have reduced insulin clearance and higher AIR than Whites, suggesting that the minimal model may underestimate insulin sensitivity in African Americans (73). These studies suggest that at least in some ethnic groups, QUICKI and HOMA-IR may only be useful as secondary outcome measurements in assessing insulin sensitivity/resistance and studies inferring lower insulin sensitivity in non-diabetic African Americans based on FSIVGTT and minimal modeling should be interpreted cautiously.
METABOLOMICS
Metabolomics is an interrogation and quantification of small-molecule metabolites in body fluids and tissues. It aims at identifying and quantifying small molecules in the sample by either using mass spectrometry (MS) or nuclear magnetic resonance (NMR) spectroscopy. The details of the methodology and its application in diabetes research are beyond the scope of this chapter. In this chapter, we will focus on new markers of insulin resistance that have been discovered using this approach. Using a non-targeted approach, Gall et al. metabolically profiled fasting plasma samples from 399 non-diabetic, clinically healthy subjects (74). Insulin sensitivity was measured using euglycemic hyperinsulinemic clamps. Individuals in the bottom tertile of the cohort were designated as insulin-resistant. Among the 485 candidate biomarkers identified, plasma α-hydroxybutyrate levels were inversely related to insulin sensitivity and this association was independent of age, sex and BMI. Other metabolites such as linoleoyl-glycerophosphocholine (L-GPC), glycine, and creatine were also highly correlated with insulin sensitivity. Using 26 metabolites from this study, the group went on to develop a model called Quantose algorithm to predict insulin resistance. Fasting insulin, α-hydroxybutyrate, L-GPC and oleate levels were included in this model. Quantose IR as a fasting surrogate of insulin sensitivity was superior to other simple surrogate measures and was able to predict the progression from normal glucose tolerance to impaired glucose tolerance (75). Branched chain amino acids (BCAAs) were found to significantly increase in obese compared to lean subjects and a BCAA based index correlated with HOMA (76). The elevation of BCAA in subjects with impaired fasting glucose and diabetes has been confirmed in subsequent studies (77).
Lipoprotein insulin resistance score (LPIR) is a novel metabolomic biomarker based on nuclear magnetic resonance (NMR) quantification of lipoprotein levels and sizes. This index has been shown to predict future type 2 diabetes mellitus is some cohorts (78). LPIR is derived from the weighted score of six lipoproteins (VLDL, LDL, and HDL sizes and concentrations) that are more strongly related to IR than each of its individual subclasses (79). A risk score of between 0-100 is estimated, with a score of 100 denoting being most insulin resistant. These metabolomic studies are promising since they can measure hundreds of metabolites in a very small sample. However, the pricing, technology, and access, precludes its use clinically. Further studies using this approach are necessary in larger more heterogeneous cohorts to replicate and validate surrogate insulin resistance markers derived through metabolomics
Table 1.
Methods for Assessing Insulin Sensitivity and Resistance in Humans
| Method | Measure of Insulin sensitivity |
|---|---|
| Direct Measures | |
| Hyperinsulinemic Euglycemic Glucose Clamp | Average glucose infusion rate (GIR) = glucose disposal rate (M). SIClamp = M/(G x ΔI), where M is normalized for G (steady-state blood glucose concentration) and ΔI (difference between fasting and steady-state plasma insulin concentrations) |
| Insulin-suppression Test (IST) | Steady-state plasma glucose (SSPG) concentrations during constant infusions of insulin and glucose with suppressed endogenous insulin secretion |
| Indirect Measures | |
| Minimal Model Analysis of Frequently Sampled Intravenous Glucose Tolerance Test (FSIVGTT) | Minimal model uniquely identifies model parameters that determine a best fit to glucose disappearance during the modified FSIVGTT. SI : fractional glucose disappearance per insulin concentration unit; SG (glucose effectiveness): ability of glucose per se to promote its own disposal and inhibit HGP in the absence of an incremental insulin effect (i.e., when insulin is at basal levels). |
| Simple Surrogate Indexes | |
| Surrogates Derived from Fasting Steady-state Conditions | |
| The Homeostasis Model Assessment (HOMA) | HOMA-IR = [(Fasting Insulin (µU/mL)) X (Fasting Glucose (mmol/L))]/22.5 |
| Quantitative Insulin Sensitivity Check Index (QUICKI) | QUICKI = 1/[Log (Fasting Insulin, µU/ml) + Log (Fasting Glucose, mg/dl)] |
| Surrogates Derived from Dynamic Tests (OGTT) | |
| Matsuda Index | ISI(Matsuda) = 10000/√[(Gfasting (mg/dl) x Ifasting (µU/ml) x (Gmean x Imean)] |
| Gutt Index - ISI (0, 120) (mg.l2.mmol-1.mIU-1.min-1) | ISI (0, 120) = 75000 + (G0-G120)(mg/l) x 0.19 x BW / 120 x Gmean (0, 120min) (mmol/l) x Log [Imean (0, 120min)](mU/l) |
Gmean, mean plasma glucose concentration during OGTT; Go, plasma glucose concentration during fasting; G120, plasma glucose concentration at 120 min; Gmean, mean plasma glucose concentration during OGTT; Imean, mean insulin concentration during OGTT; Io, plasma insulin concentration during fasting; I120, plasma insulin concentration at 120 min.
SUMMARY
In this chapter we have discussed a representative variety of methods currently available for estimating insulin sensitivity/resistance (but this is by no means an exhaustive review) (Table 1). These range from complex, time consuming, labor-intensive, invasive procedures to simple tests involving a single fasting blood sample. It is important to understand the physiological concepts informing each method so that relative merits and limitations of particular approaches are appropriately matched with proposed applications and data is interpreted correctly. The glucose clamp method is the reference standard for direct measurement of insulin sensitivity. Regarding simple surrogates, QUICKI and Log (HOMA) are among the best and most extensively validated. Dynamic tests are useful if information about both insulin secretion and insulin action are needed.
ACKNOWLEDGEMENTS
This work was supported by the Intramural Research Program, NIDDK, NIH
REFERENCES
- 1.
- Reaven G.M. The insulin resistance syndrome: definition and dietary approaches to treatment. Annu Rev Nutr. 2005;25:391–406. [PubMed: 16011472]
- 2.
- Petersen K.F., et al. The role of skeletal muscle insulin resistance in the pathogenesis of the metabolic syndrome. Proc Natl Acad Sci U S A. 2007;104(31):12587–94. [PMC free article: PMC1924794] [PubMed: 17640906]
- 3.
- DeFronzo R.A., Ferrannini E. Insulin resistance. A multifaceted syndrome responsible for NIDDM, obesity, hypertension, dyslipidemia, and atherosclerotic cardiovascular disease. Diabetes Care. 1991;14(3):173–94. [PubMed: 2044434]
- 4.
- Poirier P., et al. Obesity and cardiovascular disease: pathophysiology, evaluation, and effect of weight loss: an update of the 1997 American Heart Association Scientific Statement on Obesity and Heart Disease from the Obesity Committee of the Council on Nutrition, Physical Activity, and Metabolism. Circulation. 2006;113(6):898–918. [PubMed: 16380542]
- 5.
- Muniyappa R., et al. Current approaches for assessing insulin sensitivity and resistance in vivo: advantages, limitations, and appropriate usage. Am J Physiol Endocrinol Metab. 2008;294(1):E15–26. [PubMed: 17957034]
- 6.
- Accili D. Lilly lecture 2003: the struggle for mastery in insulin action: from triumvirate to republic. Diabetes. 2004;53(7):1633–42. [PubMed: 15220184]
- 7.
- Prodi E., Obici S. Minireview: the brain as a molecular target for diabetic therapy. Endocrinology. 2006;147(6):2664–9. [PubMed: 16556761]
- 8.
- Muniyappa R., et al. Cardiovascular actions of insulin. Endocr Rev. 2007;28(5):463–91. [PubMed: 17525361]
- 9.
- Kahn S.E., Hull R.L., Utzschneider K.M. Mechanisms linking obesity to insulin resistance and type 2 diabetes. Nature. 2006;444(7121):840–6. [PubMed: 17167471]
- 10.
- Himsworth H.P. Diabetes mellitus: its differentiation into insulin-sensitive and insulin-insensitive types. 1936. Int J Epidemiol. 2013;42(6):1594–8. [PubMed: 24415598]
- 11.
- DeFronzo R.A., Tobin J.D., Andres R. Glucose clamp technique: a method for quantifying insulin secretion and resistance. Am J Physiol. 1979;237(3):E214–23. [PubMed: 382871]
- 12.
- Katz A., et al. Quantitative insulin sensitivity check index: a simple, accurate method for assessing insulin sensitivity in humans. J Clin Endocrinol Metab. 2000;85(7):2402–10. [PubMed: 10902785]
- 13.
- Chen H., Sullivan G., Quon M.J. Assessing the predictive accuracy of QUICKI as a surrogate index for insulin sensitivity using a calibration model. Diabetes. 2005;54(7):1914–25. [PubMed: 15983190]
- 14.
- Rizza R.A., Mandarino L.J., Gerich J.E. Dose-response characteristics for effects of insulin on production and utilization of glucose in man. Am J Physiol. 1981;240(6):E630–9. [PubMed: 7018254]
- 15.
- Finegood D.T., Bergman R.N., Vranic M. Estimation of endogenous glucose production during hyperinsulinemic-euglycemic glucose clamps. Comparison of unlabeled and labeled exogenous glucose infusates. Diabetes. 1987;36(8):914–24. [PubMed: 3297886]
- 16.
- McMahon M.M., et al. Underestimation of glucose turnover measured with 6-3H- and 6,6-2H- but not 6-14Cglucose during hyperinsulinemia in humans. Diabetes. 1989;38(1):97–107. [PubMed: 2642438]
- 17.
- Radziuk J., Pye S. Quantitation of basal endogenous glucose production in Type II diabetes: importance of the volume of distribution. Diabetologia. 2002;45(8):1053–84. [PubMed: 12189437]
- 18.
- Sondergaard E., Jensen M.D. Quantification of adipose tissue insulin sensitivity. J Investig Med. 2016;64(5):989–91. [PubMed: 27073214]
- 19.
- Shen S.W., Reaven G.M., Farquhar J.W. Comparison of impedance to insulin-mediated glucose uptake in normal subjects and in subjects with latent diabetes. J Clin Invest. 1970;49(12):2151–60. [PMC free article: PMC322715] [PubMed: 5480843]
- 20.
- Harano Y., et al. Glucose, insulin, and somatostatin infusion for the determination of insulin sensitivity in vivo. Metabolism. 1978;27(9) Suppl 1:1449–52. [PubMed: 683015]
- 21.
- Pei D., et al. Evaluation of octreotide to assess insulin-mediated glucose disposal by the insulin suppression test. Diabetologia. 1994;37(8):843–5. [PubMed: 7988789]
- 22.
- Greenfield M.S., et al. Assessment of insulin resistance with the insulin suppression test and the euglycemic clamp. Diabetes. 1981;30(5):387–92. [PubMed: 7014307]
- 23.
- Mimura A., et al. Insulin sensitivity test using a somatostatin analogue, octreotide (Sandostatin). Horm Metab Res. 1994;26(4):184–7. [PubMed: 8082872]
- 24.
- Yip J., Facchini F.S., Reaven G.M. Resistance to insulin-mediated glucose disposal as a predictor of cardiovascular disease. J Clin Endocrinol Metab. 1998;83(8):2773–6. [PubMed: 9709945]
- 25.
- Facchini F.S., et al. Insulin resistance as a predictor of age-related diseases. J Clin Endocrinol Metab. 2001;86(8):3574–8. [PubMed: 11502781]
- 26.
- Yeni-Komshian H., et al. Relationship between several surrogate estimates of insulin resistance and quantification of insulin-mediated glucose disposal in 490 healthy nondiabetic volunteers. Diabetes Care. 2000;23(2):171–5. [PubMed: 10868826]
- 27.
- Bergman R.N., et al. Equivalence of the insulin sensitivity index in man derived by the minimal model method and the euglycemic glucose clamp. J Clin Invest. 1987;79(3):790–800. [PMC free article: PMC424201] [PubMed: 3546379]
- 28.
- Finegood D.T., Hramiak I.M., Dupre J. A modified protocol for estimation of insulin sensitivity with the minimal model of glucose kinetics in patients with insulin-dependent diabetes. J Clin Endocrinol Metab. 1990;70(6):1538–49. [PubMed: 2189884]
- 29.
- Saad M.F., et al. Differences between the tolbutamide-boosted and the insulin-modified minimal model protocols. Diabetes. 1997;46(7):1167–71. [PubMed: 9200652]
- 30.
- Quon M.J., et al. Direct comparison of standard and insulin modified protocols for minimal model estimation of insulin sensitivity in normal subjects. Diabetes Res. 1994;25(4):139–49. [PubMed: 7648784]
- 31.
- Yang Y.J., Youn J.H., Bergman R.N. Modified protocols improve insulin sensitivity estimation using the minimal model. Am J Physiol. 1987;253(6 Pt 1):E595–602. [PubMed: 2892414]
- 32.
- Beard J.C., et al. The insulin sensitivity index in nondiabetic man. Correlation between clamp-derived and IVGTT-derived values. Diabetes. 1986;35(3):362–9. [PubMed: 3512346]
- 33.
- Stefanovski D., et al. Insulin Action, Glucose Homeostasis and Free Fatty Acid Metabolism: Insights From a Novel Model. Front Endocrinol (Lausanne). 2021;12:625701. p. [PMC free article: PMC8010655] [PubMed: 33815283]
- 34.
- Martin B.C., et al. Role of glucose and insulin resistance in development of type 2 diabetes mellitus: results of a 25-year follow-up study. Lancet. 1992;340(8825):925–9. [PubMed: 1357346]
- 35.
- Howard G., et al. Insulin sensitivity and atherosclerosis. The Insulin Resistance Atherosclerosis Study (IRAS) Investigators. Circulation. 1996;93(10):1809–17. [PubMed: 8635260]
- 36.
- American Diabetes. A., Diagnosis and classification of diabetes mellitus. Diabetes Care. 2007;30 Suppl 1:S42–7. [PubMed: 17192378]
- 37.
- Cobelli C., et al. Estimation of insulin sensitivity and glucose clearance from minimal model: new insights from labeled IVGTT. Am J Physiol. 1986;250(5 Pt 1):E591–8. [PubMed: 3518490]
- 38.
- Toffolo G., Cobelli C. The hot IVGTT two-compartment minimal model: an improved version. Am J Physiol Endocrinol Metab. 2003;284(2):E317–21. [PubMed: 12388140]
- 39.
- Krudys K.M., et al. Integrated model of hepatic and peripheral glucose regulation for estimation of endogenous glucose production during the hot IVGTT. Am J Physiol Endocrinol Metab. 2005;288(5):E1038–46. [PubMed: 15632105]
- 40.
- Cobelli C., et al. The oral minimal model method. Diabetes. 2014;63(4):1203–13. [PMC free article: PMC4179313] [PubMed: 24651807]
- 41.
- Dalla Man C., et al. Insulin sensitivity by oral glucose minimal models: validation against clamp. Am J Physiol Endocrinol Metab. 2005;289(6):E954–9. [PubMed: 16014353]
- 42.
- Dube S., et al. Assessment of insulin action on carbohydrate metabolism: physiological and non-physiological methods. Diabet Med. 2013;30(6):664–70. [PMC free article: PMC3662485] [PubMed: 23683103]
- 43.
- Matthews D.R., et al. Homeostasis model assessment: insulin resistance and beta-cell function from fasting plasma glucose and insulin concentrations in man. Diabetologia. 1985;28(7):412–9. [PubMed: 3899825]
- 44.
- Levy J.C., Matthews D.R., Hermans M.P. Correct homeostasis model assessment (HOMA) evaluation uses the computer program. Diabetes Care. 1998;21(12):2191–2. [PubMed: 9839117]
- 45.
- Wallace T.M., Levy J.C., Matthews D.R. Use and abuse of HOMA modeling. Diabetes Care. 2004;27(6):1487–95. [PubMed: 15161807]
- 46.
- Haffner S.M., Miettinen H., Stern M.P. The homeostasis model in the San Antonio Heart Study. Diabetes Care. 1997;20(7):1087–92. [PubMed: 9203442]
- 47.
- Dabelea D., et al. Birth weight, type 2 diabetes, and insulin resistance in Pima Indian children and young adults. Diabetes Care. 1999;22(6):944–50. [PubMed: 10372247]
- 48.
- Chen H., et al. QUICKI is a useful index of insulin sensitivity in subjects with hypertension. Am J Physiol Endocrinol Metab. 2003;284(4):E804–12. [PubMed: 12678026]
- 49.
- Mather K.J., et al. Repeatability characteristics of simple indices of insulin resistance: implications for research applications. J Clin Endocrinol Metab. 2001;86(11):5457–64. [PubMed: 11701722]
- 50.
- Hanley A.J., et al. Prediction of type 2 diabetes using simple measures of insulin resistance: combined results from the San Antonio Heart Study, the Mexico City Diabetes Study, and the Insulin Resistance Atherosclerosis Study. Diabetes. 2003;52(2):463–9. [PubMed: 12540622]
- 51.
- Bastard J.P., et al. Is quantitative insulin sensitivity check index, a fair insulin sensitivity index in humans? Diabetes Metab. 2001;27(1):69–70. [PubMed: 11240450]
- 52.
- Yokoyama H., et al. Quantitative insulin sensitivity check index and the reciprocal index of homeostasis model assessment are useful indexes of insulin resistance in type 2 diabetic patients with wide range of fasting plasma glucose. J Clin Endocrinol Metab. 2004;89(3):1481–4. [PubMed: 15001651]
- 53.
- Skrha J., et al. Comparison of the insulin action parameters from hyperinsulinemic clamps with homeostasis model assessment and QUICKI indexes in subjects with different endocrine disorders. J Clin Endocrinol Metab. 2004;89(1):135–41. [PubMed: 14715840]
- 54.
- Rabasa-Lhoret R., et al. Modified quantitative insulin sensitivity check index is better correlated to hyperinsulinemic glucose clamp than other fasting-based index of insulin sensitivity in different insulin-resistant states. J Clin Endocrinol Metab. 2003;88(10):4917–23. [PubMed: 14557474]
- 55.
- Katsuki A., et al. QUICKI is useful for following improvements in insulin sensitivity after therapy in patients with type 2 diabetes mellitus. J Clin Endocrinol Metab. 2002;87(6):2906–8. [PubMed: 12050271]
- 56.
- Uwaifo G.I., et al. Indices of insulin action, disposal, and secretion derived from fasting samples and clamps in normal glucose-tolerant black and white children. Diabetes Care. 2002;25(11):2081–7. [PubMed: 12401760]
- 57.
- Sondergaard E., et al. How to Measure Adipose Tissue Insulin Sensitivity. J Clin Endocrinol Metab. 2017;102(4):1193–1199. [PMC free article: PMC5460729] [PubMed: 28323973]
- 58.
- Matsuda M., DeFronzo R.A. Insulin sensitivity indices obtained from oral glucose tolerance testing: comparison with the euglycemic insulin clamp. Diabetes Care. 1999;22(9):1462–70. [PubMed: 10480510]
- 59.
- Stumvoll M., et al. Use of the oral glucose tolerance test to assess insulin release and insulin sensitivity. Diabetes Care. 2000;23(3):295–301. [PubMed: 10868854]
- 60.
- Avignon A., et al. Assessment of insulin sensitivity from plasma insulin and glucose in the fasting or post oral glucose-load state. Int J Obes Relat Metab Disord. 1999;23(5):512–7. [PubMed: 10375055]
- 61.
- Mari A., et al. A model-based method for assessing insulin sensitivity from the oral glucose tolerance test. Diabetes Care. 2001;24(3):539–48. [PubMed: 11289482]
- 62.
- Gutt M., et al. Validation of the insulin sensitivity index (ISI(0,120)): comparison with other measures. Diabetes Res Clin Pract. 2000;47(3):177–84. [PubMed: 10741566]
- 63.
- Belfiore F., Iannello S., Volpicelli G. Insulin sensitivity indices calculated from basal and OGTT-induced insulin, glucose, and FFA levels. Mol Genet Metab. 1998;63(2):134–41. [PubMed: 9562967]
- 64.
- Cobelli C., et al. Assessment of beta-cell function in humans, simultaneously with insulin sensitivity and hepatic extraction, from intravenous and oral glucose tests. Am J Physiol Endocrinol Metab. 2007;293(1):E1–E15. [PubMed: 17341552]
- 65.
- Abdul-Ghani M.A., et al. What is the best predictor of future type 2 diabetes? Diabetes Care. 2007;30(6):1544–8. [PubMed: 17384342]
- 66.
- Muniyappa R., et al. Predictive Accuracy of Surrogate Indices for Hepatic and Skeletal Muscle Insulin Sensitivity. J Endocr Soc. 2019;3(1):108–118. [PMC free article: PMC6299271] [PubMed: 30675598]
- 67.
- Visentin R., et al. Hepatic insulin sensitivity in healthy and prediabetic subjects: from a dual- to a single-tracer oral minimal model. Am J Physiol Endocrinol Metab. 2015;309(2):E161–7. [PMC free article: PMC4504934] [PubMed: 25991649]
- 68.
- Hanson R.L., et al. Evaluation of simple indices of insulin sensitivity and insulin secretion for use in epidemiologic studies. Am J Epidemiol. 2000;151(2):190–8. [PubMed: 10645822]
- 69.
- Kodama K., et al. Ethnic differences in the relationship between insulin sensitivity and insulin response: a systematic review and meta-analysis. Diabetes Care. 2013;36(6):1789–96. [PMC free article: PMC3661854] [PubMed: 23704681]
- 70.
- Pisprasert V., et al. Limitations in the use of indices using glucose and insulin levels to predict insulin sensitivity: impact of race and gender and superiority of the indices derived from oral glucose tolerance test in African Americans. Diabetes Care. 2013;36(4):845–53. [PMC free article: PMC3609485] [PubMed: 23223406]
- 71.
- Thompson D.S., et al. Limitations of fasting indices in the measurement of insulin sensitivity in Afro-Caribbean adults. BMC Res Notes. 2014;7:98. [PMC free article: PMC3936907] [PubMed: 24555815]
- 72.
- Muniyappa R., et al. Limited predictive ability of surrogate indices of insulin sensitivity/resistance in Asian-Indian men. Am J Physiol Endocrinol Metab. 2010;299(6):E1106–12. [PMC free article: PMC3006259] [PubMed: 20943755]
- 73.
- Ha J., et al. When MINMOD Artifactually Interprets Strong Insulin Secretion as Weak Insulin Action. Front Physiol. 2021;12:601894. p. [PMC free article: PMC8100339] [PubMed: 33967818]
- 74.
- Gall W.E., et al. alpha-hydroxybutyrate is an early biomarker of insulin resistance and glucose intolerance in a nondiabetic population. PLoS One. 2010;5(5):e10883. p. [PMC free article: PMC2878333] [PubMed: 20526369]
- 75.
- Cobb J., et al. A novel fasting blood test for insulin resistance and prediabetes. J Diabetes Sci Technol. 2013;7(1):100–10. [PMC free article: PMC3692221] [PubMed: 23439165]
- 76.
- Newgard C.B., et al. A branched-chain amino acid-related metabolic signature that differentiates obese and lean humans and contributes to insulin resistance. Cell Metab. 2009;9(4):311–26. [PMC free article: PMC3640280] [PubMed: 19356713]
- 77.
- Menni C., et al. Biomarkers for type 2 diabetes and impaired fasting glucose using a nontargeted metabolomics approach. Diabetes. 2013;62(12):4270–6. [PMC free article: PMC3837024] [PubMed: 23884885]
- 78.
- Mackey R.H., et al. Lipoprotein particles and incident type 2 diabetes in the multi-ethnic study of atherosclerosis. Diabetes Care. 2015;38(4):628–36. [PMC free article: PMC4370328] [PubMed: 25592196]
- 79.
- Shalaurova I., et al. Lipoprotein insulin resistance index: a lipoprotein particle-derived measure of insulin resistance. Metab Syndr Relat Disord. 2014;12(8):422–9. [PMC free article: PMC4175429] [PubMed: 24959989]
- Review Current approaches for assessing insulin sensitivity and resistance in vivo: advantages, limitations, and appropriate usage.[Am J Physiol Endocrinol Metab....]Review Current approaches for assessing insulin sensitivity and resistance in vivo: advantages, limitations, and appropriate usage.Muniyappa R, Lee S, Chen H, Quon MJ. Am J Physiol Endocrinol Metab. 2008 Jan; 294(1):E15-26. Epub 2007 Oct 23.
- Assessing the predictive accuracy of QUICKI as a surrogate index for insulin sensitivity using a calibration model.[Diabetes. 2005]Assessing the predictive accuracy of QUICKI as a surrogate index for insulin sensitivity using a calibration model.Chen H, Sullivan G, Quon MJ. Diabetes. 2005 Jul; 54(7):1914-25.
- Comparison between surrogate indexes of insulin sensitivity/resistance and hyperinsulinemic euglycemic glucose clamps in rhesus monkeys.[Endocrinology. 2011]Comparison between surrogate indexes of insulin sensitivity/resistance and hyperinsulinemic euglycemic glucose clamps in rhesus monkeys.Lee HW, Muniyappa R, Yan X, Yue LQ, Linden EH, Chen H, Hansen BC, Quon MJ. Endocrinology. 2011 Feb; 152(2):414-23. Epub 2011 Jan 5.
- Comparison between surrogate indexes of insulin sensitivity/resistance and hyperinsulinemic euglycemic clamp estimates in rats.[Am J Physiol Endocrinol Metab....]Comparison between surrogate indexes of insulin sensitivity/resistance and hyperinsulinemic euglycemic clamp estimates in rats.Muniyappa R, Chen H, Muzumdar RH, Einstein FH, Yan X, Yue LQ, Barzilai N, Quon MJ. Am J Physiol Endocrinol Metab. 2009 Nov; 297(5):E1023-9. Epub 2009 Aug 25.
- Review Insulin- Pharmacology, Therapeutic Regimens and Principles of Intensive Insulin Therapy.[Endotext. 2000]Review Insulin- Pharmacology, Therapeutic Regimens and Principles of Intensive Insulin Therapy.Donnor T, Sarkar S. Endotext. 2000
- Assessing Insulin Sensitivity and Resistance in Humans - EndotextAssessing Insulin Sensitivity and Resistance in Humans - Endotext
- RecName: Full=Carbon monoxide dehydrogenase accessory protein CooCRecName: Full=Carbon monoxide dehydrogenase accessory protein CooCgi|6226573|sp|P31897.2|COOC_RHORUProtein
- ubiquitin carboxyl-terminal hydrolase isozyme L5 isoform X1 [Homo sapiens]ubiquitin carboxyl-terminal hydrolase isozyme L5 isoform X1 [Homo sapiens]gi|2462509889|ref|XP_054192914.1|Protein
- Homo sapiens melanoma antigen family B, 10, mRNA (cDNA clone MGC:120396 IMAGE:40...Homo sapiens melanoma antigen family B, 10, mRNA (cDNA clone MGC:120396 IMAGE:40024754), complete cdsgi|115527286|gb|BC101310.2|Nucleotide
- txid1331060[Organism] (7317)Protein
Your browsing activity is empty.
Activity recording is turned off.
See more...