Ultrasound Data Book (UBMDWF02 Cohort Exam 1)
ARIC Data Book
Cohort, Exam 1
Imputed Ultrasound Data
This section contains details concerning the imputed ultrasound datasets provided on the ARIC Visit 1 data tapes. The topics covered are:
- description of data set contents
- data sets and variable naming conventions
- imputed versus unimputed data
Description of Data Set Contents
Included on the updated data tapes are four data sets containing imputed ultrasound values. The data set names and variables included in each data set are described below.
Data Set and Variable Naming Conventions
Data Sets Containing Imputed Values
Because gender-race specific regression models were used to perform the imputation, a separate data set exists for White Males, White Females, Black Males, and Black Females. Each data set name consists of UBMD (indicating ultrasound) + IM (indicating the data are imputed) + WM, WF, BF, or BM (indicating the specific gender-race group). For example, the data set containing imputed ultrasound data for white males is named UBMDIMWM. Similarly, the data set containing imputed ultrasound data for black females is named UBMDIMBF. A similar pattern holds for the other gender-race groups.
The variables contained within the data sets are summarized in the table below. Most variable names consist of LBIA, RBIA, LOPA, ROPA, LINA, or RINA (indicating location) + DA or WA (indicating the type of statistic) +45 (indicating that the measurement is of the far wall). There are a few other summary variables which have unique names. These are included in the following list.
| VARIABLE | DESCRIPTION | TYPE |
|---|---|---|
| ID | Participant ID number | Character |
| *DA45 | Imputed site-specific average far wall thickness *=LBIA, RBIA, LOPA, ROPA, LINA, RINA | Continuous |
| *WA45 | Weight for site-specific imputed average wall thickness *=LBIA, RBIA, LOPA, ROPA, LINA, RINA | Continuous |
| SUM45_1 | Simple average of *DA45 | Continuous |
| SUM45_2 | Weighted average of *DA45 | Continuous |
| SUM45_3 | Z score summary statistic for *DA45 | Continuous |
| SUMWT45 | Number of observed values / 6 = weight for SUM45_1, 2, or 3 | Continuous |
Imputed versus Unimputed Data
You may want to rerun analyses previously run on unimputed (observed) ultrasound data (using the UBMD4 data set), on imputed data (using the UBMDIMxx data sets, where xx can be BM, BF, WM, or WF). Because of the naming conventions used, this should be a relatively easy task. Note that the data set containing unimputed ultrasound data (UBMD) contains variables of average far wall width, such as LINAAV45 and LBIAAV45. These unimputed variables on the UBMD data set correspond to the imputed variables LINADA45 and LBIADA45, respectively, on the UBMDIMxx data sets. Thus, only the middle component of the variable name must be changed for AV (unimputed average) to DA (imputed average). This logic holds true for all of the site-specific averages.
Use of Weights
The weights are a measure of precision which varies by number of sites observed. Regression estimates, using *DA45 or SUM45_1 as dependent variables, will generally be more precise if weighted regression is used.
ARIC Data Book
Cohort, Exam 1
Appendix A
B-Mode Derived Variable Site Prefixes
| LAN | Left Common Carotid: Anterior Angle |
| RAN | Right Common Carotid: Anterior Angle |
| LBI | Left Bifurcation |
| RBI | Right Bifurcation |
| LIN | Left Internal Carotid |
| RIN | Right Internal Carotid |
| LOP | Left Common Carotid: Optimal Angle |
| ROP | Right Common Carotid: Optimal Angle |
| LPO | Left Common Carotid: Posterior Angle |
| RPO | Right Common Carotid: Posterior Angle |
| LPP | Left Popliteal |
| RPP | Right Popliteal |
| QC1 | First QC Repeat Scan (refer to QC01 for site identification) |
| QC2 | Second QC Repeat Scan (refer to QC02 for site identification) |
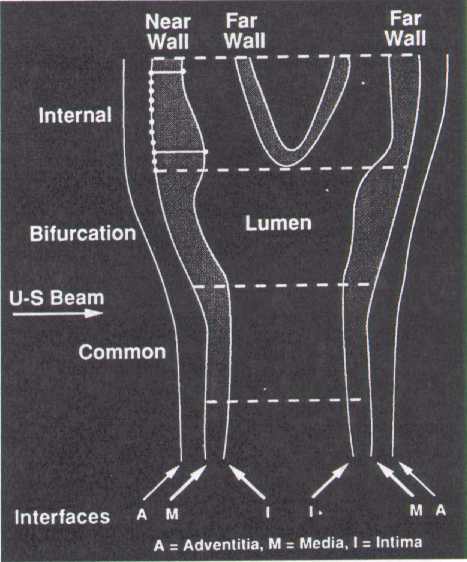
Interfaces:
- Boundary between the periadventitia and adventitia of the near wall (not measured)
- Boundary between the adventitia and media of the near wall
- Boundary between the intima of the near wall and the blood
- Boundary between blood and intima of the far wall
- Boundary between media and adventitia of the far wall
- Boundary between adventitia and periadventitia of the far wall (not measured)
Max 23 = B-A; Max 45 = D-C; Min 34 = H-G
The extracranial carotid system is divided into one-centimeter segments: I = internal carotid; II = carotid bifurcation; III = common carotid. A maximum of eleven measurements is made by URC readers on each arterial wall interface, in each arterial segment. These measurements are placed equidistant at 1 millimeter intervals, represented by the eleven points placed on interface B2 on the internal carotid. Also shown on this schematic is the definition of a maximum and a minimum wall thickness variable.
ARIC Data Book
Cohort, Exam 1
Ultrasound data
Imputed, white female

| LBIADA45 | Derived Average Far Wall Thickness, Left Bifurcation | |
|---|---|---|
| N | Value | Description |
| 5759 | Range | 0.223333 - 4.19867 ( median=0.725285 mean=0.7682381 std=0.2695829 ) |
| 197 | Missing | |
| LBIAWA45 | Weight For LBIADA45 | |
|---|---|---|
| N | Value | Description |
| 345 | 0.1666666667 | |
| 607 | 0.3333333333 | |
| 540 | 0.5 | |
| 380 | 0.6666666667 | |
| 164 | 0.8333333333 | |
| 3724 | 1 | |
| 196 | Missing | |
| LINADA45 | Derived Average Far Wall Thickness, Left Internal Carotid | |
|---|---|---|
| N | Value | Description |
| 5759 | Range | 0.201 - 5.27067 ( median=0.614536 mean=0.6517283 std=0.2552713 ) |
| 197 | Missing | |
| LINAWA45 | Weight For LINADA45 | |
|---|---|---|
| N | Value | Description |
| 371 | 0.1666666667 | |
| 734 | 0.3333333333 | |
| 847 | 0.5 | |
| 818 | 0.6666666667 | |
| 454 | 0.8333333333 | |
| 2536 | 1 | |
| Missing | ||
| LOPADA45 | Derived Average Far Wall Thickness, Left Common Carotid: Optimal Angle | |
|---|---|---|
| N | Value | Description |
| 5759 | Range | 0.220143 - 2.32267 ( median=0.614167 mean=0.6283274 std=0.1484248 ) |
| 197 | Missing | |
| LOPAWA45 | Weight For LOPADA45 | |
|---|---|---|
| N | Value | Description |
| 275 | 0.1666666667 | |
| 311 | 0.3333333333 | |
| 209 | 0.5 | |
| 133 | 0.6666666667 | |
| 54 | 0.8333333333 | |
| 4778 | 1 | |
| 196 | Missing | |
| RBIADA45 | Derived Average Far Wall Thickness, Right Bifurcation | |
|---|---|---|
| N | Value | Description |
| 5760 | Range | 0.201 - 4.63975 ( median=0.7437 mean=0.79587 std=0.28963 ) |
| 196 | Missing | |
| RBIAWA45 | Weight For RBIADA45 | |
|---|---|---|
| N | Value | Description |
| 344 | 0.1666666667 | |
| 565 | 0.3333333333 | |
| 593 | 0.5 | |
| 401 | 0.6666666667 | |
| 142 | 0.8333333333 | |
| 3715 | 1 | |
| 196 | Missing | |
| RINADA45 | Derived Average Far Wall Thickness, Right Internal Carotid | |
|---|---|---|
| N | Value | Description |
| 5760 | Range | 0.201 - 4.49509 ( median=0.656028 mean=0.7028254 std=0.2848085 ) |
| 196 | Missing | |
| RINAWA45 | Weight For RINADA45 | |
|---|---|---|
| N | Value | Description |
| 373 | 0.1666666667 | |
| 727 | 0.3333333333 | |
| 810 | 0.5 | |
| 817 | 0.6666666667 | |
| 385 | 0.8333333333 | |
| 2648 | 1 | |
| 196 | Missing | |
| ROPADA45 | Derived Average Far Wall Thickness, Right Common Carotid: Optimal Angle | |
|---|---|---|
| N | Value | Description |
| 5760 | Range | 0.223333 - 2.52367 ( median=0.604979 mean=0.6229415 std=0.1418786 ) |
| 196 | Missing | |
| ROPAWA45 | Weight For ROPADA45 | |
|---|---|---|
| N | Value | Description |
| 262 | 0.1666666667 | |
| 328 | 0.3333333333 | |
| 280 | 0.5 | |
| 175 | 0.6666666667 | |
| 67 | 0.8333333333 | |
| 4648 | 1 | |
| 196 | Missing | |
| SUM45_1 | Mean Of The DA45 Variables | |
|---|---|---|
| N | Value | Description |
| 5759 | Range | 0.371791 - 2.283583 ( median=0.663605 mean=0.6949877 std=0.1689784 ) |
| 197 | Missing | |
| SUM45_2 | Weighted Mean Of The DA45 Variables | |
|---|---|---|
| N | Value | Description |
| 5759 | Range | 0.375923 - 2.223951 ( median=0.664554 mean=0.6950539 std=0.1662920 ) |
| 197 | Missing | |