Primary tumor site
Cancer samples can be grouped by the primary site - organ or tissue type where the tumor originates from. This definition does not account for tissues affected by metastasis.

A number of context-dependent mutational patterns have been identified in cancer genomics data recently. However, much remains unknown about progression and heterogeneity of mutagenic processes in different cancers and their diagnostic potential. MutaGene explores context-dependent mutational profiles in 37 cancer types and their underlying components, signatures, from more than 9000 genomes and exomes. This collection of mutational profiles allows to compare mutagenic processes between different cancer types and elucidates the heterogeneity within the cancer subtypes by analyzing individual cancer samples.
Clustering of cancer samples in a space of mutational signatures allows to distinguish four major clusters of cancer samples exposed to similar mutagenic processes. Moreover, given a cancer type or a particular mutagenic process, MutaGene can calculate genome-wide context-dependent mutability of DNA sites and expected amino acid substitutions. Mutability can serve as a background model for identification of potential driver mutations thereby linking cancer genotype with the phenotype. It helps to decouple the relative contributions of mutagenesis and selection in carcinogenesis. Mutations from a cancer sample can be submitted in VCF format; Mutagene will identify its mutational profile, decompose it into individual mutational signatures and find the closely related cancer type, primary site and a cluster of samples with similar mutational profiles.
In order to avoid a selection bias towards more frequently sequenced genes or mutations identified by genotyping, we only considered whole genome and whole exome-sequenced samples originating from the International Cancer Genome Consortium (ICGC) projects, the Cancer Genome Atlas (TCGA) and the Pediatric Cancer Genome Project (PCGP). We relied on COSMIC (WGS) annotation of somatic mutations in cancer samples. We included single base substitutions in protein-coding genomic loci discarding insertions and deletions.
Cancer samples with similar histology can share many mutations affecting the same genomic sites, in part due to non-neutral selection on these particular sites (hotspots). A mutational profile represents context-dependent propensities determined by the mutagenic processes rather than selection; therefore any biases originating from selection were removed by discarding recurring mutations affecting the same genomic site.
We used a reference assembly of the human genome GRCh38 for identifying the DNA sequences of each mutated gene transcript. The neighboring nucleotides in 5' and 3' directions from the mutated base constitute the nucleotide context of a mutation. It was assumed that each mutation affects both complementary strands, thus C→T mutation also implies G→A mutation, and can be written as C:G→T:A. Altogether, 6 mutation types in 16 possible 5’3’ contexts result in 96 context-dependent mutation types.


Profile data can be accessed with REST API:
            https://0-www-ncbi-nlm-nih-gov.brum.beds.ac.uk/projects/mutagene/api/signatures/[freq|count]/PROFILE_ID

            For instance:
            https://0-www-ncbi-nlm-nih-gov.brum.beds.ac.uk/projects/mutagene/api/signature_data/freq/9010

            Returning data in tab-separated format:
                A[C>A]A 0.009201252937
                A[C>G]A 0.003621769773
                A[C>T]A 0.012823022709
                A[T>A]A 0.002740798747
                A[T>C]A 0.006558339859
                A[T>G]A 0.000587314017
                A[C>A]C 0.007928739233
                A[C>G]C 0.005971025842
                A[C>T]C 0.010571652310
                A[T>A]C 0.005383711825
                A[T>C]C 0.004992169146
                A[T>G]C 0.001664056382
                A[C>A]G 0.003034455756
                A[C>G]G 0.002740798747
                A[C>T]G 0.064506656226
                A[T>A]G 0.003621769773
                ...

            https://0-www-ncbi-nlm-nih-gov.brum.beds.ac.uk/projects/mutagene/api/signature_data/count/9010
            Same format for mutation counts:
                A[C>A]A 94.000000000000
                A[C>G]A 37.000000000000
                A[C>T]A 131.000000000000
                A[T>A]A 28.000000000000
                A[T>C]A 67.000000000000
                A[T>G]A 6.000000000000
                A[C>A]C 81.000000000000
                A[C>G]C 61.000000000000
                A[C>T]C 108.000000000000
                A[T>A]C 55.000000000000
                A[T>C]C 51.000000000000
                A[T>G]C 17.000000000000
                A[C>A]G 31.000000000000
                A[C>G]G 28.000000000000
                A[C>T]G 659.000000000000
                A[T>A]G 37.000000000000
                A[T>C]G 57.000000000000
                A[T>G]G 26.000000000000
                A[C>A]T 61.000000000000
                ...
Cancer type definitions were derived from the classification of cancers from the existing large-scale cancer projects. MutaGene uses ICGC Data Coordination Center (DCC) project codes where available (http://docs.icgc.org/submission/projects/), thus attributing all cancer samples within a project to a particular cancer type. For instance, BRCA-UK is classified as Breast Triple Negative/Lobular Cancer. Multiple projects can be assigned to the same cancer type; project codes are listed on Explore page in MutaGene. The number of samples and mutations included in each profile varies and depends largely on the cancer type. The number of mutations excluding recurring ones is specified in a separate column. MutaGene excludes mutational signatures that consist of less than a hundred of non-recurring mutations.

List of profiles by cancer type can be accessed with REST API:
            https://0-www-ncbi-nlm-nih-gov.brum.beds.ac.uk/projects/mutagene/api/signatures

            Returning data in JSON format:
            {
              "data": [
                {
                  "cancer_code": "",
                  "cancer_projects": "",
                  "cancer_type": "Pan-cancer",
                  "id": 33999,
                  "mut_type": "A",
                  "n_mutations": 1780931,
                  "n_samples": 9450,
                  "name": "Pancancer",
                  "nr_mutations": 1487673,
                  "primary_site": "All tissues",
                  "signature_type": "PC"
                },
                {
                  "cancer_code": "T-ALL",
                  "cancer_projects": [
                    {
                      "code": "T-ALL-PCGP",
                      "cosmic_id": 643,
                      "cosmic_url": "http://cancer.sanger.ac.uk/wgs/study/overview?study_id=643",
                      "url": "http://explore.pediatriccancergenomeproject.org"
                    }
                  ],
                  "cancer_type": "Acute Lymphoblastic Leukemia (T-cell)",
                  "cancer_type_id": 23,
                  "id": 9028,
                  "mut_type": "A",
                  "n_mutations": 208,
                  "n_samples": 15,
                  "name": "Acute Lymphoblastic Leukemia (T-cell)",
                  "nr_mutations": 163,
                  "primary_site": "Blood",
                  "signature_type": "CT"
                },...

Molecular determinants of mutagenic cellular processes may result in characteristic mutational patterns that often depend on particular DNA sequence contexts, so called muational signatures. A context-dependent mutational profile is a manifestation of all mutagenic processes and can be viewed as a combination of mutational signatures. Mutational profiles can be decomposed into the underlying mutagenic components represented by mutational signatures providing the insights into etiology and progression of cancer.
MutaGene applies non-smooth nonnegative matrix factorization method to all cancer samples with more than 50 mutations and reports several decompositions depending on the required level of detalization. The most general decomposition consists of five mutational signatures. These signatures are numbered A.1, A.2...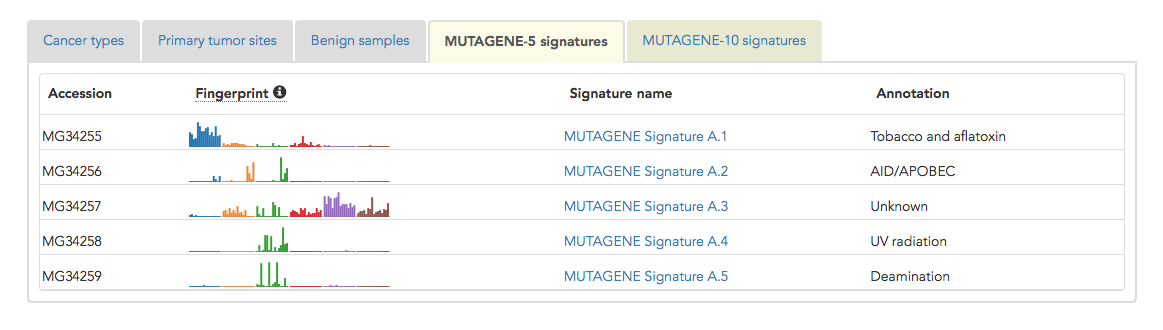

Previously several large-scale computational analyses identified a set of mutational signatures by numeric deconvolution of mutations in cancer samples using nonnegative matrix factorization (NMF) since this method yields a sparse representation of data that can be used for an annotation of individual processes. Previous studies applied NMF to cancer genomes available at the time and identified between 5 and 30 context-dependent mutational signatures. However, many of these signatures correlate with each other, which makes it difficult to separate and characterize individual mutational processes in many cases. In addition to two sets of signatures obtained in MutaGene (Mutagene5 and Mutagene10), Mutagene also provides an access to 30 signatures listed in COSMIC database (COSMIC-30) (Alexandrov L.B. et al., Nature 2013).
MutaGene provides multiple options for comparative analysis of mutational profiles and signatures. One-to-one comparison includes a tool for choosing the type of profile for the comparison, i.e. cancer type, primary site or mutational signatures.

Additionally, MutaGene allows a pairwise comparison of sets of signatures using one of the similarity measures listed above. Comparison results are reported in the form of a heatmap matrix, where rows and columns are ordered according to UPGMA clustering.


We analyzed contribution of mutational signatures in each sample and compared all samples based on the combinations of contributing mutagenic factors. Four clusters were found to be an optimal number (in terms of average silhouette coefficient) for agglomerative clustering of cancer samples. The most representative cancer types in each cluster are listed in the table below the clustering map. Multidimensional scaling method t-SNEs was used in order to visualize the multidimensional clustering results.

MutaGene provides a set of tools to annotate any query set of mutations. This capability may be used to identify cancers of unknown primary site, to recognize the most likely mutagenic process, to distinguish tumorigenic from non-tumorigenic cells. First, in order to calculate query mutational profile, MutaGene obtains sequence contexts for each listed mutation according to chosen genome assembly and shows it as query mutational profile. Then it compares query profile to other mutational profiles in the MutaGene database using Bayesian classifier and ranks them according to the likelihood. Additionally Mutagene decomposes the query profile into mutational signatures.
MutaGene accepts mutations in MAF or VCF formats. Note that it is necessary to specify human genome assembly version used for mapping the variants in VCF or MAF file.
          ##fileformat=VCFv4.1
          #CHROM  POS ID      REF ALT
Alternatively, for analysis of mutations in other genomes (viral, bacterial, etc) it is possible to provide mutations in trinucleotide format.
This format specifies the 5' and 3' nucleotide context of the mutated nucleotide base.
          ACG > ATG
          CGT > CAT
          AAA > ATA
          GGG > GTG
          CCG > CAG
          GTA > GCA
          CCA > CAA
          TCG > TAG

The first step in the analysis is building a mutational profile.
Query profile represents a mutational profile calculated for all provided mutations.


Context-dependent mutational models derived by this approach allow calculating the expected probabilities of nucleotide and amino acid substitutions in each DNA and protein position, connecting the processes operating at DNA level to protein phenotype. Given a protein-coding sequence and a mutational profile, MutaGene computes mutability for each DNA position and probabilities for each type of amino acid substitution accessible by point mutation.
A mutational profile describes mutational frequencies depending on 3' and 5' nucleotide sequence context. Mutational profile describes a combined effect of all the mutational processes that resulted in accumulation of mutations observed in a cohort of patients. Mutational signature, on the other hand, represents mutations characteristic for one mutational process, or a subset of mutational processes. MutaGene applies a mutational profile or a signature to DNA sequence in order to analyze possible mutations and their outcomes on the protein level.
Given the number of cancer samples used to construct mutational profile, $N$, and the number of different trinucleotides of type $t$ in a diploid human exome, $n_t$ (calculated from the reference genome), the mutability of a nucleotide mutation is calculated as: $$p_m^{nuc} = \frac{f_m}{N n_t}$$ In protein-coding sequences it is practical to calculate mutation probability for a codon in its local (pentanucleotide) context, given contexts of each nucleotide in the codon. For a given transcript of a protein, at exon boundaries the local context of the nucleotides was taken from the genomic context. Transcripts were chosen as the COSMIC consensus transcript. Changes in codons can lead to amino acid substitutions, silent and nonsense mutations. Therefore, we calculate a probability to observe a specific type of codon change which can be realized by single nucleotide mutations at each codon position i as: $$ p_M^{codon} = 1 - \prod_{i}^{3}(1 - \sum_{j}^{k}p_{ij}^{nuc}) $$ where $k$ denotes a number of mutually exclusive mutations at codon position $i$.
$B_{score}$ uses the binomial model to calculate the probability of observing a certain type of mutation in a given site more frequently than $k$: $$ B_{score} = \sum_{k=n+1}^{N} {N \choose k} p^k(1-p)^{N-k} $$ where $p$ is the mutability value for a mutation (either nucleotide or codon) and $k$ is the number of observed mutations of a given type at a particular nucleotide or codon. Depending on the dataset chosen or a particular cohort of patients, for instance, corresponding to a cancer type, the total number of samples $N$ and the numbers of observed mutations $k$ will change.


Using our combined benchmark dataset we calibrated two thresholds: the first corresponds to the maximum MCC coefficient, and the second corresponds to 10% false positive rate (FPR).
Mutations with B-score below the first threshold are predicted to be “cancer drivers”, whereas mutations with scores in between two thresholds are predicted to be “potential drivers”.
All mutations with scores above the second threshold are predicted as “passengers”. Importantly, calculations can be performed using pan-cancer cohort or for a particular cancer type, the latter would result in a cancer-specific ranking of mutations and could be useful for identification of driver mutations in a particular type of cancer.

Mutability of DNA bases depending on their local sequence context is shown on the first track as a green line, the scale for mutability values represents mutability per cancer sample per Megabase of exome sequence.
Mutability of codons is shown on the second track as an orange line, the values representing mutability per cancer sample per codon (trinucleotide). The table below shows expected amino acid substitutions for each codon as a heatmap, with the highest intensity corresponding to highest mutability.


For a given gene and mutational process (or combination thereof) selected MutaGene ranks mutations based on the $B_score$ and predicts them to be drivers, potential passengers and drivers based on the thresholds determined with a benchmark. Mutations observed in cancer patients are listed in the table along with their recurrence frequencies (number of patients with this mutation), expected codon mutability and the corresponding $B_score$. Mutations are ranked by $B_score$.


The website provides options to download mutability calculation results for DNA and protein level. However, in some cases it may be necessary to run batch queries on a set of genes or apply a range of mutational profiles or signatures to a gene. We provide basic REST API for downloading mutability calculation with a programmatic interface. The only required input is PROFILE_ID and GENE_NAME. Profile ID can be looked up in Explore as accessions, API requires specifying the number following MG prefix in the accession. HGMD gene names are used according to COSMIC annotation for reference genome GRCh38. Below is an example of an URL to download mutability results.
          /projects/mutagene/api/gene_mutability/PROFILE_ID/GENE_NAME

          For intance,

          /projects/mutagene/api/gene_mutability/9032/TP53
Output:
          mutation  mutability  observed_wgs  observed_other
          M1I 1.867836  0 0
          M1K 0.282314  0 0
          M1R 0.167741  0 0
          M1T 0.706160  0 0
          E2A 0.198713  0 0
          E2D 2.315188  0 0
          E2E 1.955007  0 0
          E2G 0.280316  0 0
          E2K 0.761322  0 0
          E2Q 0.405796  0 0
          E2V 0.257891  0 0
          E2* 0.643823  0 0
          ...