U.S. flag

An official website of the United States government

NCBI Bookshelf. A service of the National Library of Medicine, National Institutes of Health.

Davis S, Martyn-St James M, Sanderson J, et al. A systematic review and economic evaluation of bisphosphonates for the prevention of fragility fractures. Southampton (UK): NIHR Journals Library; 2016 Oct. (Health Technology Assessment, No. 20.78.)

Cover of A systematic review and economic evaluation of bisphosphonates for the prevention of fragility fractures

A systematic review and economic evaluation of bisphosphonates for the prevention of fragility fractures.

Show details

Chapter 3Assessment of clinical effectiveness

A systematic review of the literature with evidence synthesis including a network meta-analysis (NMA) was conducted in order to evaluate the clinical effectiveness and safety of alendronic acid, risedronic acid, oral ibandronic acid, i.v. ibandronic acid and zoledronic acid in the prevention of fragility fractures.

The systematic review of clinical effectiveness was undertaken in accordance with the general principles recommended in the Preferred Reporting Items for Systematic Reviews and Meta-Analyses (PRISMA) statement.43

Methods for reviewing effectiveness

The protocol for this review is registered with PROSPERO (CRD42013006883).44

Identification of studies

A comprehensive search was undertaken to systematically identify clinical effectiveness literature relating to alendronic acid, risedronic acid, oral ibandronic acid, i.v. ibandronic acid, and zoledronic acid within their licensed indications for the prevention of fragility fractures. The search strategy comprised the following main elements:

  • searching of electronic databases
  • contact with experts in the field
  • scrutiny of bibliographies of retrieved papers.

The following databases were searched:

  • MEDLINE In-Process & Other Non-Indexed Citations and MEDLINE (via Ovid) from 2008 to 23 September 2014
  • EMBASE (via Ovid) from 2008 to 23 September 2014
  • Cochrane Database of Systematic Reviews (via Wiley Online Library) from 2008 to 23 September 2014
  • Database of Abstracts of Reviews of Effects (via Wiley Online Library) from 2008 to 23 September 2014
  • Cochrane Central Register of Controlled Trials (via Wiley Online Library) from 2008 to 23 September 2014
  • Health Technology Assessment Database (via Wiley Online Library) from 2008 to 23 September 2014
  • Cumulative Index to Nursing and Allied Health Literature (via EBSCOhost) from 2008 to 23 September 2014
  • Science Citation Index Expanded (via Web of Science) from 2008 to 23 September 2014
  • Conference Proceedings Citation Index – Science (via Web of Science) from 2008 to 23 September 2014
  • Bioscience Information Service (via Web of Science) from 2008 to 23 September 2014.

Existing evidence reviews20 commissioned by NICE, which included literature published up to June 2008, were assumed to have identified all papers relevant to this review published prior to 2008. Therefore, searches were limited by date from 2008 until 26 September 2014. Searches were not restricted by language or publication type. Subject headings and keywords for ‘osteoporosis’ were combined with each of the named drug interventions. The MEDLINE search strategy is presented in Appendix 1. The search was adapted for the other databases. Highly sensitive study design filters were used to retrieve clinical trials and systematic reviews on MEDLINE and other databases, where appropriate. Consultee submissions and relevant systematic reviews were also hand-searched in order to identify any further relevant clinical trials. Two clinical trials research registers (ClinicalTrials.gov and the WHO’s International Clinical Trials Registry Platform) were also searched for ongoing and recently completed research projects. Citation searches of key included studies were also undertaken using the Web of Science database. All potentially relevant citations were downloaded to Reference Manager bibliographic software (version 12.0; Thomson Reuters, Philadelphia, PA, USA) and deduplication of citation records was undertaken.

Inclusion and exclusion criteria

Inclusion criteria have been defined in line with the final scope provided by NICE23 and are outlined below.

Study selection process

The selection of eligible articles was undertaken by two reviewers (MMSJ and EG). Both reviewers sifted all downloaded citations (4117). Citations not meeting the exclusion criteria based on the title and/or abstract were excluded at the sifting stage. All potentially relevant citations were marked to be obtained at full text for further scrutiny. A check for consistency was undertaken using a Cohen’s kappa coefficient of inter-rater agreement. A high level of agreement between reviewers (0.951) was observed. Any uncertainty regarding the eligibility of potentially relevant full-text articles was resolved through discussion. Articles that were obtained as full text for screening that were subsequently excluded were recorded together with the reason for exclusion. A table of excluded studies at full text with reason is presented in Appendix 2, Table 41.

Inclusion criteria

Studies were included in the review if they met the inclusion criteria outlined below.

Interventions

Any of the following interventions were included:

  • alendronic acid (oral)
  • risedronic acid (oral)
  • ibandronic acid (oral)
  • ibandronic acid (i.v.)
  • zoledronic acid (i.v.).

Studies in which the interventions were assessed in line with licensed indications were included in the systematic review. Studies that titrated doses upwards from unlicensed to licensed doses within treatment groups during the trial period were eligible for inclusion. Studies that evaluated both licensed and unlicensed dose study groups were included where outcome data only for the licensed group could be extracted. Data reported for licensed and unlicensed doses combined (pooled study groups) were not eligible for inclusion.

With respect to ibandronic acid, the licence authorisation was supported by trials assessing the antifracture efficacy of 2.5 mg per day orally and 20 mg every other day orally (dose not licensed) compared with placebo [iBandronate Osteoporosis vertebral fracture trial in North America and Europe (BONE)45,46] and assessing non-inferiority of oral daily dosing (2.5 mg) compared with oral monthly dosing (100 mg or 150 mg) on BMD [the Monthly Oral iBandronate In LadiEs (MOBILE) trial].47,48 A bridging study then demonstrated superiority for the current licensed i.v. dose of 3 mg every 3 months compared with the 2.5 mg once daily oral dose in terms of BMD [the Dosing IntraVenous Administration (DIVA) trial].49,50 As such, these pivotal trials along with other trials comparing ibandronic acid 2.5 mg with placebo were eligible for inclusion in addition to those assessing current licensed doses.

Populations

Studies were included that evaluated women aged ≥ 65 years or men aged ≥ 75 years. Studies were included if they evaluated women aged ≤ 64 years and men aged ≤ 74 years in the presence of risk factors, for example previous fragility fracture, current use or frequent recent use of oral or systemic glucocorticoids, a history of falls, a family history of hip fracture, other causes of secondary osteoporosis, low BMI (< 18.5 kg/m2), smoking or an alcohol intake of > 14 units per week in women or > 21 units per week in men. Studies were also included if they evaluated women aged ≤ 64 years and men aged ≤ 74 years with low BMD (a T-score of –1 SD or more below the young adult mean). Studies that recruited mixed populations of men and women were also included, as were studies that recruited samples with mixed population characteristics, for example if they recruited a sample of women aged ≤ 65 years with and without risk fractures.

In studies evaluating participants with risk factors for or the presence of secondary osteoporosis [e.g. treatment with aromatase inhibitors or androgen deprivation therapy (ADT)] that did not evaluate a treatment of interest within its licensed indication, advice was sought from the clinical advisor (PS) regarding inclusion.

Comparators

Relevant comparators included interventions compared with each other. Interventions could be compared with placebo or other non-active treatments (i.e. treatment without the potential to augment bone). Studies that administered calcium and/or vitamin D to patients in both the intervention and comparator arms were included (e.g. bisphosphonate plus calcium vs. placebo plus calcium).

Outcomes

Eligible outcomes for consideration included fragility fractures, BMD at the femoral neck, mortality, adverse effects, compliance, HRQoL and health-care resource use. These are described in full in Chapter 2, Decision problem.

Study design

Randomised controlled trials (RCTs) were eligible for inclusion in the clinical effectiveness systematic review. If no RCTs were identified for an intervention, non-randomised studies were considered for inclusion. Non-randomised studies were also considered for inclusion, where necessary, as a source of additional evidence [e.g. relating to adverse events (AEs), long-term incidence of fragility fracture, treatment persistence, etc.] associated with the interventions. This evidence was considered important for demonstrating rare, catastrophic and delayed AEs of treatments along with information regarding long-term treatment continuance and concordance that are not captured by RCTs. Observational studies can provide information about how technologies function in real-world settings. For this assessment report, this evidence was summarised from existing systematic reviews.

Studies published as abstracts or conference presentations were eligible for inclusion only if sufficient details were presented to allow an assessment of the trial methodology and results to be undertaken.

Exclusion criteria

The following types of studies were excluded from the review:

  • studies in patients with normal or unspecified BMD who were not selected based on the presence of risk factors
  • studies in patients with other indications for bisphosphonate treatment, for example Paget’s disease, hypercalcaemia of malignancy, metastatic breast cancer
  • studies in which administration of interventions was not in accordance with the licensed indications
  • studies in which interventions were co-administered with any other therapy with the potential to augment bone, unless concomitant treatments are specified in the SmPC
  • systematic reviews and clinical guidelines (these were used as sources of references)
  • studies that were considered methodologically unsound in terms of study design or the method used to assess outcomes
  • studies that were published only in languages other than English
  • studies based on animal models
  • preclinical and biological studies
  • narrative reviews, editorials, opinions
  • reports published as abstracts or conference presentations only, where insufficient details were reported to allow an assessment of study quality or results.

Data abstraction strategy

Data relevant to the decision problem were extracted by two reviewers (MMSJ or EG). Data were extracted without blinding to authors or journal. A data extraction form was developed and piloted on two included trials before use on all included trials. Data relating to study arms in which the intervention treatments were administered in line with their licensed indications were extracted; data relating to the unlicensed use of the interventions were not extracted. MMSJ and EG checked at least 10% of each other’s data extraction forms. All extracted outcome data to be used in the analyses were double-checked by a third reviewer (FC). The safety data extracted were informed by the SmPCs for each product (available from www.medicines.org.uk/emc/).3137 The key safety issues included such items as the number of patients experiencing AEs, the number of patients withdrawing because of AEs, the number of patients experiencing upper GI tract symptoms, the number of patients with osteonecrosis of the jaw, hypocalcaemia, bone pain, atypical femoral fractures, atrial fibrillation or stroke, and the number of patients experiencing flu-like symptoms. Outcome data that were presented only in graphical format were digitised and estimated using xyExtract software (version 5.1; Wilton and Cleide Pereira da Silva, Paraiba, Brazil). Where multiple publications of the same study were identified, data extraction was undertaken on all relevant associated publications and findings were presented together with reference to their published source.

Critical appraisal strategy

The methodological quality of each included study was assessed by one reviewer (MMSJ or EG). The quality of included studies was assessed using the Cochrane Risk of Bias Tool.51 This tool addresses specific domains, namely sequence generation, allocation concealment, blinding of participants and personnel, blinding of outcome assessment, incomplete outcome data and selective outcome reporting. RCTs were classified as being at ‘high risk’ of attrition bias if dropout in any treatment arm was ≥ 10%.52 In order to inform the selective reporting domain of the Cochrane Risk of Bias Tool, a judgement was made that peer-reviewed articles which reported approval of a trial protocol or a trial registration number could be considered as being at ‘low risk’ of bias for this domain. All quality assessment findings were double checked by a second reviewer (MMSJ or EG).

Methods of data synthesis

The extracted data were presented for each study both in structured tables and as a narrative description.

Methods for the estimation of efficacy using network meta-analysis

Network meta-analysis methods are described in full alongside results in Methods for the network meta-analyses, with further details provided in Appendix 3.

Supplementary meta-analyses

Where considered appropriate, secondary outcomes of interest were analysed using classical meta-analysis methods. Meta-analysis was undertaken using Cochrane Review Manager software (version 5.2, The Cochrane Collaboration, Copenhagen, Denmark). Outcomes reported as continuous data were summarised using a mean difference with 95% confidence intervals (CIs). Dichotomous outcomes were summarised as risk ratios (RRs) with associated 95% CIs. Where RCTs reported AEs in sufficient detail, these were analysed as dichotomous data. Clinical heterogeneity across RCTs (the degree to which RCTs appear different in terms of participants, intervention type, and duration and outcome type) was considered prior to data pooling. Random-effects models were applied. Effect estimates, estimated in Review Manager as z-scores, were considered statistically significant at a p-value < 0.05.

Results

Quantity and quality of the available research

The searches described in Identification of studies identified 4117 potentially relevant citations from searches of electronic databases after removal of duplicates. A further 83 citations were identified from an existing evidence review commissioned by NICE.20 Of these records, 4056 were excluded at the title or abstract stage. Full texts of 144 citations were obtained for scrutiny. Of these, 85 citations were excluded (excluded studies with reason for exclusion is presented in Appendix 2, Table 41). A total of 46 RCTs,45,47,49,5395 reported across 59 citations, were included in the review.

The search process is summarised in the form of a PRISMA flow diagram96 in Figure 3.

FIGURE 3. Flow diagram of study selection process (adapted from PRISMA): clinical effectiveness review.

FIGURE 3

Flow diagram of study selection process (adapted from PRISMA): clinical effectiveness review.

The summary of the included RCTs is presented in Table 2 and the characteristics of the included RCTs are presented in Table 3.

TABLE 2

TABLE 2

Summary of RCTs by treatment

TABLE 3

TABLE 3

Characteristics of included studies: clinical effectiveness review

Study and population characteristics of included trials

A summary of the number of RCTs and citations by treatment along with the author, trial name (where reported) and population is presented in Table 2. The trial design of the included studies including country, inclusion/exclusion criteria, treatment doses and numbers randomised, outcome assessment methods and final follow-up are presented in Table 3. Characteristics of included participants including sex, age and baseline femoral neck BMD and fractures are presented in Table 4.

TABLE 4

TABLE 4

Characteristics of participants in included RCTs

Alendronic acid

Alendronic acid was compared with placebo in 17 RCTs reported across 19 publications.53,55,57,60,61,64,65,67,68,71,73,76,83,84,91,93,94,97,98 Two RCTs65,71 did not include a placebo comparison, but evaluated alendronic acid combined with calcium compared with calcium alone.

Randomised controlled trial location and funding

Four RCTs were multicentre RCTs undertaken in the USA55,61,64,67 and six RCTs were international multicentre RCTs.76,83,84,91,94,98 One multicentre RCT was undertaken in Italy53 and one in Canada.73 Single-centre RCTs were undertaken in Italy,60 Turkey65 and Jordan.93 The countries and number of participating centres was unclear for one RCT57 and the number of participating centres was unclear for one RCT undertaken in China.71 RCT sponsor details were not reported for four RCTs.53,60,65,93 The total numbers of participants randomised ranged from 6393 to 4432.64 Where reported, RCTs typically excluded patients with underlying conditions or receiving medications that affect bone metabolism, and patients either with upper GI tract disorders or receiving medication for the condition.

Populations recruited and treatment dosage

Fourteen RCTs recruited postmenopausal women and evaluated 10 mg per day of alendronic acid.53,55,57,60,61,64,65,67,68,71,76,84,91,93 Two of these RCTs also included an evaluation of other doses of alendronic acid not currently licensed.76,91,98 Two of the RCTs in postmenopausal women reported that participants were switched from a 5 mg daily dose of oral alendronic acid to 10 mg per day after 24 months, spending the remaining 12 months of the RCT on 10 mg per day.55,64 One RCT evaluated a daily dose of 10 mg of oral alendronic acid in men with osteoporosis,83 one RCT evaluated a daily 10 mg dose of oral alendronic acid in men and women (51% male) with airways disease94 and one RCT evaluated 70 mg per week of oral alendronic acid in men with ADT bone loss in non-metastatic prostate cancer.73 One RCT, in men and women (37.4% male) with underlying diseases requiring long-term oral glucocorticoid therapy, evaluated 5 mg or 10 mg per day of oral alendronic acid (two active treatment groups) and reported fracture outcomes for both groups combined (data not used in the analysis for this assessment report).91

Adjuvant therapy

Adjuvant treatment in the form of calcium alone or in combination with vitamin D was reported for all RCTs. The doses varied across the RCTs (see Table 3).

Bone mineral density of recruited participants

Inclusion criteria varied across the RCTs in terms of baseline BMD and T-scores (skeletal site and cut-off). Seven RCTs53,57,60,71,76,84,93 reported inclusion criteria that would identify women with osteoporosis according to the current WHO definition.1 Two RCTs recruited women aged 55–81 years with a femoral neck BMD of ≤ 2 SDs below that of a normal young adult,55,64 an additional inclusion criterion for one of these RCTs being the presence of at least one vertebral fracture.55 One RCT recruited women aged 42–75 years with lumbar spine BMD approximately 2 SDs below the young normal value,61 and another RCT recruited women with BMD ≥ 2 SDs below young adult mean at either lumbar spine or femoral neck.65 One RCT recruited ambulatory women aged 65 years in long-term care with a lumbar spine or total hip BMD T-score of ≤ –2.0 SDs.67 One RCT recruited community-dwelling women aged 65 years.67 Femoral neck BMD above mean peak was an exclusion criterion for one RCT.68 One RCT recruited men and women with underlying diseases requiring long-term oral glucocorticoid therapy, irrespective of baseline BMD.91 One RCT recruited men with femoral neck and lumbar T-scores of < 2 SDs and < 1 SD below the normal for young men, or femoral neck BMD of ≤ 1 SD below the normal for young men plus vertebral deformity or fracture.83 The RCT in men and women with airways disease included only participants with a T-score of < –2.5 SDs or z-score of < –1.0 at hip or lumbar spine.94 The RCT in men with ADT bone loss reported that 38% of all participants had osteopenia and 7% had osteoporosis.73

Age, race, years post menopause, body mass index and smoking status

The mean age of participants was in the sixth decade (between 51 and 60 years) in two RCTs.53,91 One RCT did not report mean age, but recruited women aged 44–73 years.60 Another RCT not reporting mean age included participants 61–69 years.94 In one RCT, the mean age of all included participants was 73.6 years73 and in all others the mean age of included participants was between 61 and 70 years. Seven RCTs in women reported on the number of years since menopause.53,57,61,65,70,84,93 The mean number of years since menopause ranged from 10 to 15 years with the exception of one RCT recruiting women after hysterectomy, in which the mean number of years since menopause was 22.57 BMI was available for 12 RCTs.53,55,61,64,65,68,71,76,83,84,91,93 Across these RCTs, all mean BMI values were > 18.5 kg/m2. In one RCT,93 the mean BMI was > 30 kg/m2. Race of included participants was reported by eight RCTs.55,57,61,64,67,71,84,91 One of these studies recruited 100% East Asian women.71 Across the other RCTs the proportion of Caucasian participants was ≥ 90%.55,57,61,64,67,84,91 Smoking status was reported by five trials,53,55,64,73,94 with four reporting that ≥ 10% of included participants were current smokers.53,55,64,94 Mean smoking duration of 26.2 years and mean quantity of 0.98 packs per day were reported by one RCT.73

Fractures at baseline

The presence of fractures or fracture history at baseline was reported by nine RCTs.53,55,64,67,68,71,73,76,83 One reported that 5% of all participants had vertebral fractures,53 one that 37% had vertebral fractures71 and one that 41.9% had vertebral fractures.83 One RCT reported that 64% of participants had at least one vertebral fracture and that 14% had three or more vertebral fractures.55 One study reported that 21% of participants had vertebral fractures and 5% had non-vertebral fractures at baseline.76 Fifty-five per cent of participants in one RCT had a history of fracture.67 One RCT reported that, of the 47% who reported prior fracture, 1% had a history of hip or vertebral fracture.73 One RCT reported that 36% had experienced fractures since age 50 years68 and another RCT reported that 35% had experienced fractures since age 45 years.64

Assessment of treatment compliance

Compliance with treatment in the form of a pill count was assessed by three RCTs.53,55,64

Follow-up and participants completing randomised controlled trials

Final follow-up was 12 months in six RCTs,65,71,73,84,93,94 24 months in five RCTs,53,57,61,67,83 30 months in one RCT,60 36 months in three RCTs55,68,76 and 48 months in one RCT.64 One RCT reported an initial follow-up of 12 months,91 with an extension to 24 months.98

The number of participants completing was not reported for two RCTs60,67 (Table 5). Overall completion rates of ≥ 90% were reported by seven RCTs53,55,64,68,71,73 (see Table 5). The highest rate of participant withdrawal was reported by Shilbayeh et al. 2004,93 with 40% of participants withdrawing overall (see Table 5).

TABLE 5

TABLE 5

Outcome data reported by included RCTs

Post-treatment fracture assessment

Fractures were not assessed as an outcome in four RCTs.53,61,71,93 Across the RCTs assessing fractures, classification of the fracture and the method of assessment was diverse (see Table 3). Five RCTs recorded fractures as AEs,57,67,68,73,84 four of which did not report details of the assessment method.57,67,68,73 Vertebral fractures were assessed by seven RCTs.55,60,64,65,76,83,91 All seven RCTs reported that vertebral fractures were assessed radiographically. One of the RCTs also assessed clinical fractures (non-spine clinical fractures, hip fractures, wrist fractures and clinical vertebral fractures, and other clinical fractures) reported by participants and confirmed by radiography55 and one reported that clinical fractures (clinical vertebral, hip or wrist) were assessed by participant self-reports and confirmed by radiograph.64 One RCT reported that non-vertebral fractures were assessed from patient reporting and confirmed by radiography.83

Post-treatment femoral neck bone mineral density assessment

Femoral neck BMD assessment was reported by all but one of the RCTs.60 Where assessed, BMD assessment was by DXA. With the exception of one RCT that did not report on DXA manufacturer65 all studies assessed BMD using DXA Hologic or Luner machines.

Ibandronic acid

Oral ibandronic acid at a dosage of 150 mg per month was evaluated against placebo in two RCTs,74,80 and 2.5 mg per day of oral ibandronic acid was evaluated against placebo in one RCT.45 This RCT also evaluated oral ibandronic acid at a dosage of 20 mg every other day for 12 doses per month (unlicensed dose). One RCT evaluated 2.5 mg per day of oral ibandronic acid, 2 mg i.v. every 2 months (unlicensed dose) and 3 mg i.v. every 3 months (current licensed dose).49 One RCT evaluated 2.5 mg per day, 50 mg twice per month (unlicensed dose), 100 mg per month (unlicensed dose) and 150 mg per month (current licensed dose) of oral ibandronic acid.47 Where reported, RCTs typically excluded patients with underlying conditions or receiving medications that affect bone metabolism, and patients with upper GI tract disorders or receiving medication for these conditions.

Randomised controlled trial location and funding

All five RCTs were multicentre RCTs: one was undertaken in the UK,74 one in the USA,80 one in Europe and the USA,45 one in the USA, Canada, Mexico, Europe, Australia and South Africa,49 and one in the USA, Canada, Europe, Australia, South Africa, Mexico and Brazil.47 The RCT sponsor details were reported for all five RCTs. The total numbers of participants randomised ranged from 5074 to 2946.45

Populations recruited and treatment dosage

All of the RCTs recruited postmenopausal women; one recruited postmenopausal women with a histologically confirmed diagnosis of oestrogen receptor-positive breast cancer.74

Adjuvant therapy

Daily adjuvant treatment in the form of 500 mg of calcium and 400 IU (international unit) of vitamin D was prescribed across all five RCTs.

Bone mineral density of recruited participants

Four of the RCTs45,47,49,80 reported inclusion criteria that would identify women with osteoporosis according to the current WHO definition.1 The RCT in women with breast cancer recruited women classified as osteopenic (T-scores of > –2.5 SDs and < –1.0 SD at either the lumbar spine or total hip).74

Age, race, years post menopause and body mass index

Four RCTs recruited participants with a mean age between 61 and 70 years.45,47,49,74 Mean age in the other RCT was 53.6 years.80 The mean number of years since menopause, in one RCT recruiting early postmenopausal women, was 4.2 years.80 Mean years since menopause was 20.8 in one trial,45 18.7 in one RCT49 and 18.6 in another RCT.47 One RCT did not report on years since menopause.74 Mean BMI values were > 18.5 kg/m2 in all RCTs. One RCT reported a median BMI of < 30 kg/m2 in both placebo and ibandronic acid participants.74 Race of included participants was not reported by any RCT.

Fractures at baseline

The presence of fractures at baseline was reported by three RCTs:45,47,49 one in which 93% of participants had at least one vertebral fracture at baseline and 43% had two,45 one in which 42.1% had fractures at baseline49 and one in which 4.9% had fractures at baseline.47

Assessment of treatment compliance

Compliance with treatment in the form of a pill count was assessed by one RCT.74

Follow-up and participants completing RCTs

Final follow-up was 12 months in two RCTs,47,80 24 months in two RCTs49,74 and 36 months in one RCT.45 None of the RCTs reported a completion rate of ≥ 90% (see Table 5).

The highest rate of participant withdrawal was reported by the BONE trial,45 with 34% participants withdrawing overall (see Table 5).

Post-treatment fracture assessment

Fractures were recorded as AEs, but the assessment method was not reported in two RCTs.47,74 Two RCTs also assessed fractures as AEs confirmed by radiography.49,80 The number of vertebral fractures confirmed by radiography was the primary outcome in one RCT.45

Post-treatment femoral neck bone mineral density assessment

Femoral neck BMD assessment was reported by all of the RCTs. BMD assessment was by DXA using Hologic or Lunar machines.

Bone mineral density and antifracture efficacy of ibandronic acid pivotal randomised controlled trials

One of the three placebo-controlled RCTs in ibandronic acid was the pivotal 3-year BONE study, in which the antifracture efficacy of daily oral ibandronic acid 2.5 mg and intermittent oral ibandronic acid 20 mg every other day for 12 doses every 3 months (unlicensed dose) was assessed over 36 months.45 The BONE RCT reported comparable vertebral antifracture efficacy of daily and intermittent administration, suggesting that ibandronic acid could be administered at intervals longer than daily or weekly. A further non-inferiority RCT, the MOBILE trial,47 evaluated a monthly dose of 100 mg of ibandronic acid administered as two single 50-mg doses on consecutive days; a single monthly 100-mg dose; a single monthly 150-mg dose; and a daily 2.5-mg dose (four ibandronic acid study groups). The 150-mg dose (licensed dose) produced the greatest gains in BMD compared with a daily 2.5-mg dose of ibandronic acid at 2 years (lumbar spine BMD: 6.6% vs. 5.0%, respectively; p < 0.001).47 The DIVA study then compared the efficacy of two regimens of intermittent i.v. injections of ibandronic acid [2 mg every 2 months (unlicensed dose) and 3 mg quarterly (licensed dose)] with a daily 2.5-mg dose of oral ibandronic acid. The regimen of daily 2.5 mg oral ibandronic acid has proven antifracture efficacy.49 At 2 years, the 2- and 3-monthly i.v. regimens produced improvements in spinal BMD (6.4% and 6.3%, respectively) that were superior to oral ibandronic acid (4.8%; p < 0.001). The MOBILE and the DIVA studies confirmed a sustained efficacy of monthly oral and quarterly i.v. regimens, respectively, over 5 years.108,109

Risedronic acid

Risedronic acid was evaluated against placebo in 12 RCTs reported across 15 publications.58,62,63,66,70,72,75,78,85,86,89,95,99101

Randomised controlled trial location and funding

Three RCTs were multicentre RCTs undertaken in the USA.63,70,78 One multicentre RCT was undertaken in Australia,72 one was undertaken in China75 and one was undertaken in the UK.86 Three RCTs were international multicentre RCTs.58,66,85 One single-centre RCT was undertaken in Germany.89 The number of participating centres was unclear for one RCT undertaken in Canada62 and one RCT undertaken in the USA.95 With the exception of one RCT (two publications),89,101 sponsor details were reported for all included studies. The total numbers of participants randomised ranged from 4095 to 9331.78

Populations recruited and treatment dosage

Six RCTs recruited postmenopausal women and evaluated 5 mg per day of risedronic acid.66,70,72,75,78,85 Two of these RCTs also included an evaluation of other doses of risedronic acid not currently licensed.66,78 Both of these RCTs reported fracture outcomes for participants in the 2.5-mg and 5-mg groups combined (data not used in the analysis for this assessment report). One RCT evaluated oral risedronic acid at a dosage of 35 mg per week in men with osteoporosis58 and one RCT evaluated oral risedronic acid at 5 mg per day in men with osteoporosis.89 Two RCTs evaluated 35 mg of oral risedronic acid per week in men with non-metastatic prostate cancer receiving ADT.62,95 Two RCTs in men and women63,86 (32.5% male63 and 38% male,86 respectively) receiving glucocorticoids evaluated oral risedronic acid at a dosage of 5 mg per day. Where reported, RCTs typically excluded patients with underlying conditions or receiving medications that affect bone metabolism, and patients with upper GI tract disorders or receiving medication for these conditions.

Adjuvant therapy

Adjuvant treatment in the form of calcium alone or in combination with vitamin D was reported for all RCTs. The dosages varied across the RCTs (see Table 3).

Bone mineral density of recruited participants

Inclusion criteria varied across the RCTs in terms of baseline BMD and T-scores (skeletal site and cut off). Six RCTs58,66,72,75,78,89 reported inclusion criteria that would identify men and women with osteoporosis according to the current WHO definition.1 One RCT recruited women aged ≤ 85 years with at least one vertebral fracture at baseline70 and another RCT recruited women aged ≤ 85 years with at least two radiographically confirmed vertebral fractures.85 Baseline BMD was not an inclusion criterion for either of the two RCTs in men and women receiving glucocorticoids63,86 or the two RCTs in men with prostate cancer receiving ADT.62,95

Age, race, years post menopause and body mass index

The mean age of participants was between 51 and 60 years in three RCTs.72,86,89 One RCT categorised women by age into two groups: those aged 70–79 years and those aged ≥ 80 years.78 In two RCTs, the mean age of all included participants was 71 years.85,95 In all other RCTs the mean age of included participants was between 61 and 70 years. Five RCTs in women reported on the number of years since menopause.66,70,72,75,85 The mean number of years since menopause was 15 years in one RCT,75 17 years in another RCT66 and ranged from 24 to 25 years in two RCTs.70,85 The mean number of years since menopause was < 5 years in one RCT.72 In the RCT categorising women by age into two groups (those aged 70–79 years and those ≥ 80 years), the mean number of years since menopause was 28 years and 37 years, respectively.78 The mean years since menopause in one RCT recruiting early postmenopausal women was 3.7 years.72 BMI was available for five RCTs.58,66,70,75,89 Across these RCTs, all mean BMI values were > 18.5 kg/m2. Race of included participants was reported by only one of the RCTs in which proportion of Caucasian participants was 95%.58

Fractures at baseline

The presence of fractures or fracture history at baseline was reported by eight RCTs,63,66,70,72,78,85,86,89 with 20% of women in one RCT having vertebral fractures at baseline.72 In two RCTs approximately 31% of all participants had baseline vertebral fractures,63,66 and in one RCT 35% had vertebral fractures.86 One RCT reported that 42% had vertebral fractures at baseline78 and one that 52% had vertebral fractures.89 In one trial, 80% of all participants had vertebral fractures at baseline.70 One RCT reported the median number of vertebral fractures at baseline, which was three in the placebo group and four in the risedronic acid group.85

Assessment of treatment compliance

Compliance with treatment in the form of a pill count was assessed by two RCTs.58,95

Follow-up and participants completing randomised controlled trials

Final follow-up was 12 months in three RCTs63,75,86 and 24 months in four RCTs.58,62,66,72 One RCT reported a final follow-up of 6 months95 and another reported a follow-up of 36 months.78 One RCT reported an initial follow-up of 12 months,89 with an extension to 24 months.101 Two RCTs reported an initial follow-up of 36 months,70,85 with an extension to 60 months.99,100

The number of participants completing the trial was not reported by three RCTs62,75,95 (see Table 5). Only one RCT reported a completion rate of ≥ 90%89 (see Table 5). The highest rate of participant withdrawal was reported by McClung et al.,78 with 40% participants withdrawing overall (see Table 5).

Post-treatment fracture assessment

Fractures were not assessed as an outcome in four RCTs.62,75,86,95 Across the RCTs assessing fractures, classification of the fracture and the method of assessment were diverse (see Table 3). One recorded clinical fractures (non-vertebral and vertebral fractures) confirmed by radiography as AEs.99 This was an extension to a RCT in which vertebral fractures were the primary outcome and were assessed radiographically.70 One RCT recorded non-vertebral fractures (not described) and vertebral fractures as AEs, with vertebral fractures assessed radiographically.66 Vertebral fractures were assessed by six other RCTs.58,63,72,85,86,89 All six RCTs reported that vertebral fractures where assessed radiographically. One of these RCTs also assessed clinical vertebral and non-vertebral fractures reported as AEs; vertebral fractures reported as AEs included symptomatic and asymptomatic radiographically confirmed fractures.58 One RCT assessed radiographically confirmed hip fractures and non-vertebral osteoporotic fractures; non-vertebral osteoporotic fractures were defined as all radiographically confirmed fractures of the wrist, leg, humerus, hip, pelvis or clavicle.78

Post-treatment femoral neck bone mass density assessment

Femoral neck BMD assessment was reported by all of the RCTs. BMD assessment was by DXA using Hologic or Lunar machines.

Zoledronic acid

Zoledronic acid was evaluated against placebo in four RCTs.56,59,77,79

Randomised controlled trial location and funding

All four RCTs were international multicentre RCTs. Sponsor details were reported for all trials and it was the same sponsor across the RCTs. The total number of participants randomised ranged from 40079 to 7765.56

Populations recruited, bone mass density of participants and treatment dosage

Two RCTs recruited postmenopausal women with osteoporosis56,79 and one recruited men with osteoporosis.59 Across these RCTs, baseline BMD and T-scores would identify men and women with osteoporosis according to the current WHO definition.1 One RCT recruited ambulatory men (24.5%) and women who had undergone repair of a hip fracture.77 Baseline BMD was not an inclusion criterion for this RCT. All RCTs evaluated 5 mg per year of i.v. zoledronic acid.

Adjuvant therapy

Adjuvant treatment in the form of calcium in combination with vitamin D was reported for all RCTs. The dosages varied across the RCTs (see Table 3).

Age, race, years post menopause and body mass index

The mean age of participants in the Health Outcomes and Reduced Incidence with Zoledronic acid Once Yearly (HORIZON) RCTs was between 61 and 70 years.56,77 The mean age of all participants was 66 years in one trial59 and 60 years in another trial.79 The mean number of years since menopause was reported for only one RCT and was 11.4.79 BMI was available for three RCTs,56,77,79 and across these RCTs, all mean BMI values were > 18.5 kg/m2. The race of included participants was reported by all four RCTs, and > 90% of the participants were Caucasian.

Fractures at baseline

The presence of fractures at baseline was reported by three of the RCTs,56,59,77 one of which reported all patients who were enrolled in the RCT had undergone repair of a hip fracture.77 One RCT reported that 28% of participants had one vertebral fracture at baseline and 35% had more than two.56 One RCT reported that 22.1% of participants had one vertebral fracture at baseline and 10.8% had more than two.59

Assessment of treatment compliance

An assessment method of compliance was not reported by any RCT evaluating zoledronic acid with placebo.

Follow-up and participants completing randomised controlled trials

Final follow-up was 24 months in two RCTs59,79 and 36 months in the other two RCTs.56,77 The proportion of participants completing each of the RCTs was 83.9%,56 71.1%,77 89.2%59 and 89.3%.79 (see Table 5).

Post-treatment fracture assessment

Fractures were assessed as an outcome in three RCTs.56,59,77 One RCT assessed vertebral fractures from radiographs.56 In this RCT, clinical fracture reports were also obtained from patients at each visit and non-vertebral fracture reports required central confirmation. Fractures of the toe, facial bone, finger and those caused by excessive trauma were excluded. In another RCT, non-vertebral fractures (not a vertebral, facial, digital or skull fracture) were confirmed when a radiograph, a radiographic report or a medical record documented a new fracture.77 In this RCT, a new clinical vertebral fracture was defined as new or worsening back pain with a reduction in vertebral body height. The third RCT assessed vertebral fractures from radiographs.59 In this RCT, clinical fractures (vertebral and non-vertebral) were reported by participants at each visit and were verified centrally by means of a radiographic report or surgical notes.

Post-treatment femoral neck bone mineral density assessment

Femoral neck BMD assessment by DXA was reported by all of the RCTs. Only one RCT reported the DXA model (Hologic or Lunar machines).79

Head to head
Alendronic acid versus ibandronic acid

One RCT compared alendronic acid with monthly oral ibandronic acid (at a dose of 150 mg) in postmenopausal women;81 there was no placebo arm in this trial. This was a multicentre non-inferiority RCT conducted in North America, Latin America, Europe and South Africa, with sponsor details reported. In total, 1760 women were randomised. Mean age was 65.6 years, mean years since menopause was 18.3 years, mean BMI was 25.9 kg/m2 and race of participants was reported as 82% Caucasian. BMD inclusion criteria were based on lumbar spine [lumbar vertebrae 2–4 (L2–L4)] BMD T-score of < –2.5 and ≥ –5.0 SDs. Previous fractures (not described) were experienced by 38.2% of the alendronic acid group and 39% of the ibandronic acid group. Patients with either upper GI tract disorders or diseases affecting bone metabolism were excluded. The alendronic acid dosage was 70 mg per week and the ibandronic acid dosage was 150 mg per month. Both groups also received 500 mg of calcium and 400 IU of vitamin D per day. For compliance assessment, returned study tablets were counted. Fractures were recorded as AEs and follow-up was 12 months. Overall, 90% of participants completed the 12-month follow-up (see Table 5).

Alendronic acid vs. risedronic acid

Five RCTs across seven publications compared alendronic acid with risedronic acid in postmenopausal women.54,82,87,90,92,104,105 There was no placebo arm in any of these RCTs.

Three RCTs evaluated 10 mg per day of alendronic acid and 5 mg per day of risedronic acid.54,82,92 Two of these RCTs were undertaken in Turkey54,92 and the other in Italy.82 The number of participating centres and RCT sponsor details were not reported for any of the RCTs. One trial randomised 28 participants (14 in each group)54 and one randomised 50 participants (25 in each group).92 The third trial randomised 2000 participants to treatment groups also including clodronic acid and raloxifene. In total, 1000 participants were randomised to risedronic acid and 100 to alendronic acid82 (10 : 1 randomisation ratio). All three RCTs reported osteoporosis to be an inclusion criterion, but only one reported a BMD T-score inclusion criterion.54 Mean ages were 66 years,54 70.5 years82 and 58.8 years.92 One RCT reported on mean years since menopause, which was 15.6 years,54 and one RCT92 reported on mean BMI, which was 27.3 kg/m2. Race was not reported by any of the three RCTs. All three RCTs prescribed a daily adjuvant of calcium and vitamin D. Fractures at baseline were not reported by two of the RCTs;54,82 however, in the other trial, approximately 10% of participants in both groups had vertebral fractures at baseline.92 Two of the RCTs reported fracture as an outcome82,92 and one reported fracture as an AE;92 however, details of the assessment method were not reported by either RCT. Final follow-up was at 12 months in two RCTs54,92 and 24 months in the third.82 Two of the RCTs reported 12-month femoral neck BMD assessment by DXA, using either a Hologic54 or Lunar machine.92 None of the three RCTs reported on numbers withdrawing, but all reported that 100% of participants randomised were included in the analysis (see Table 5). Where reported, conditions or medications affecting bone metabolism were exclusion criteria, with one RCT also considering upper GI conditions as an exclusion criterion.92

Two further RCTs undertaken by the same study group compared 70 mg per week of alendronic acid with 35 mg per week of risedronic acid in postmenopausal women.87,90 One was undertaken as a 12-month multicentre RCT in the USA,90 with a 12-month extension to 24 months,104 and the other was a 12-month multicentre RCT across 75 centres in 27 countries in Europe, the Americas and the Asia-Pacific region,87 with a 12-month extension to 24 months.105 Sponsor details were the same across these RCTs. The number randomised was 1053 in the US study90 and 936 in the multinational study.87 Both RCTs recruited postmenopausal women with osteoporosis according to the current WHO definition.1 Mean age, years since menopause and BMI was 64.5 years, 18.5 years and 25.3 kg/m2, respectively, in the US study90 and 64.1 years, 16.9 years and 25.3 kg/m2, respectively, in the international study.87 The last RCT reported that participants with conditions or medications affecting bone metabolism were excluded. Both RCTs reported that > 90% of participants were Caucasian and both RCTs prescribed a daily adjuvant of 1000 mg of calcium and 400 IU of vitamin D.

The study undertaken in the USA reported that 12% of participants had a history of hip, spine or wrist fracture after the age of 45 years.90 The multinational study reported that 33.7% of participants had a history of fractures (not described), and that 41% had a family history of osteoporosis.87 Across both RCTs, clinical fractures that occurred during the trial, regardless of association with trauma or skeletal site, were reported by investigators as clinical AEs. Femoral neck BMD was assessed in both RCTs using DXA (Hologic). Both RCTs reported a completion rate of > 90% at the 12-month follow-up87,90 (see Table 5).

Zoledronic acid versus alendronic acid

One RCT evaluated 5 mg once per year of i.v. zoledronic acid with 70 mg per week of alendronic acid.69 There was no placebo arm in this trial and the sponsor was reported. In total, 604 postmenopausal women aged 55–90 years with a BMD T-score of ≤ –2.0 SDs at total hip or lumbar spine were randomised. Both groups were prescribed a daily adjuvant of 1200 mg of calcium and 800 IU of vitamin D. The mean age of participants was 67.8 years and mean BMI was 26.2 kg/m2. Of all the participants, 33% had fractures (not described) at baseline and the proportion of participants who were current or previous smokers was 22.9%. Participants with conditions affecting bone metabolism were excluded. Fractures and femoral neck BMD were not outcomes for this RCT. Quality of life was assessed using a visual analogue scale (VAS) and compliance was assessed by investigator or study personnel at each visit.106 The triallists reported that > 90% of participants completed the 12-month follow-up (see Table 5).

Zoledronic acid versus risedronic acid

One RCT reported as the HORIZON study [i.e. not the HORIZON – Pivotal Fracture Trial (HORIZON-PFT) or HORZON – Recurrent Fracture Trial (HORIZON-RFT), which compared zoledronic acid vs. placebo] recruited men and women aged 18–85 years receiving at least 7.5 mg of oral prednisolone daily (or equivalent) and who were expected to receive glucocorticoids for at least another 12 months.88 There was no placebo arm in this trial. The RCT, which was an international multicentre RCT, categorised 416 participants receiving steroids for > 3 months as a ‘treatment’ subgroup and 417 participants receiving steroids for ≤ 3 months as a ‘prevention’ subgroup; both subgroups were randomised to receive 5 mg of i.v. zoledronic acid once annually or 5 mg per day of risedronic acid. The RCT sponsor was reported. All treatment groups were prescribed a daily adjuvant of 1200 mg of calcium and 800 IU of vitamin D. Across treatment groups, 31% were male, the mean age of all participants was 54.4 years and race was not reported. Participants with conditions or previous treatments affecting bone metabolism were excluded. Follow-up was at 12 months. Vertebral fractures were assessed by radiography and femoral neck BMD by DXA (Hologic or Lunar). EuroQol (EQ-5D) HRQoL was assessed.110 The triallists reported that > 90% of participants completed the 12-month follow-up (see Table 5).

Quality of the available research

Of the 46 included RCTs,45,47,49,5395 21 were considered to be at low risk of selection bias;47,49,5557,59,64,6770,72,73,77,79,81,87,88,90,93,94 however, the majority (25/46) of the included RCTs did not report a method of random-sequence generation and were therefore classified as being at unclear risk of selection bias.45,53,54,58,6063,65,66,71,7476,78,80,8286,89,91,92,95 A summary of all risk-of-bias criteria judgements by RCT is reported in Figure 4. A summary about each risk-of-bias item presented as percentages across all included RCTs is presented in Figure 5.

FIGURE 4. Risk-of-bias summary: judgements about each risk-of-bias item for each included RCT.

FIGURE 4

Risk-of-bias summary: judgements about each risk-of-bias item for each included RCT.?, unclear risk of bias; +, low risk of bias, –, high risk of bias; ALN, alendronic acid; IBD, ibandronic acid; RIS, risedronic acid; ZOL, zoledronic acid.

FIGURE 5. Risk-of-bias graph: judgements about each risk-of-bias item presented as percentages across all included RCTs.

FIGURE 5

Risk-of-bias graph: judgements about each risk-of-bias item presented as percentages across all included RCTs.

Of the 46 included RCTs, 12 reported appropriate methods for concealment of treatment allocation and were therefore judged to be at low risk of bias for this domain.55,56,59,64,68,70,77,79,81,87,88,90 The remaining 34 RCTs did not report on allocation concealment and were therefore judged as being at unclear risk of bias for this domain.

Thirty-four of the included RCTs45,5558,6164,6668,70,7277,7981,8391,9395 reported that participants and personnel were blind to treatment allocation and were therefore judged at low risk of performance bias. Five RCTs were reported as either open label or single blind and were judged as being at high risk of bias.53,71,82,92,106 The remaining RCTs did not report on blinding and were considered to be at unclear risk of bias for this domain.

Blinding of the outcome assessment was reported by 13 RCTs,55,56,59,64,68,70,76,77,83,8789,94 which were therefore classified as being at low risk of detection bias. The remaining RCTs were considered at unclear risk of bias for this domain.

In 29 of the RCTs,45,47,49,5659,63,65,66,69,70,72,73,7681,8385,8991,93,94,111 attrition was reported to be ≥ 10% across treatment groups and, therefore, these RCTs were judged to be at high risk of attrition bias. In eight of the included RCTs,53,55,64,68,8688,95 attrition across treatment groups was reported as < 10% and these RCTs were judged at low risk of attrition bias. In the remaining nine RCTs,54,6062,67,71,75,82,92 numbers withdrawing were not reported; these RCTs were therefore considered at unclear risk of bias for this domain.

Thirty-four of the included RCT reports45,5559,6372,7480,8385,8791,9395 contained either reference to a RCT protocol or a RCT registration number, and were therefore judged as being at low risk of selection bias. The remaining included RCTs did not contain this information and were therefore judged to be at unclear risk of bias for this domain.

Assessment of effectiveness

Outcome measures prespecified in the final protocol reported across the included RCTs are presented in Table 5.

Fracture

A total of 27 RCTs provided suitable fracture data for inclusion in the NMA reported in Results from the network meta-analyses: nine RCTs compared alendronic acid with placebo;55,57,61,64,65,67,76,83,84 two compared monthly oral ibandronic acid with placebo;74,80 one compared 2.5 mg per day of oral ibandronic acid with placebo;45 nine compared risedronic acid with placebo;58,63,66,70,72,78,85,86,89 three compared zoledronic acid with placebo;56,59,77 one compared alendronic acid with 150 mg per month of oral ibandronic acid;81 one compared alendronic acid with risedronic acid;82 and one compared zoledronic acid with risedronic acid.88

Alendronic acid

In the Fracture Intervention Trial (FIT) I, Black et al.55 reported a RR of 0.53 (95% CI 0.41 to 0.68) for morphometric vertebral fractures, and a relative hazard of 0.45 (95% CI 0.27 to 0.72) for clinical vertebral fractures and 0.72 (95% CI 0.58 to 0.90) for the risk of any clinical fracture at the 36-month follow-up. The relative hazards for hip fracture and wrist fracture were reported as 0.49 (95% CI 0.23 to 0.99) and 0.52 (95% CI 0.31 to 0.87), respectively. In FIT II, Cummings et al.64 reported a RR for radiographically detected vertebral fractures at 36 months of 0.65 (95% CI 0.39 to 0.80). The relative hazard of clinical fractures (vertebral, hip or wrist) was reported as 0.64 (95% CI 0.50 to 0.82) in women with osteoporosis and 1.08 (95% CI 0.87 to 1.35) in those without osteoporosis. In the RCT by Carfora et al.,60 vertebral fractures were reported for 8.82% of placebo participants, compared with 2.94% of alendronic acid participants. The RCT by Dursun et al.65 reported vertebral fractures at 12 months in 40.0% of the group assigned to calcium and 31.6% in the alendronic acid combined with calcium group. The difference between treatments in these RCTs was not reported. Orwoll et al.83 reported a significant difference between treatments at 24 months in new vertebral fractures (p = 0.02) but not non-vertebral fractures (p = 0.8) in men.

Across the RCTs assessing fractures as AEs, Bone et al.57 reported that the difference between treatments in non-vertebral fractures (foot, ankle, rib) was not significant (p-value not reported). Greenspan et al.67,68 reported that the difference between treatments in clinical fractures (not described) was not significant (p-values not reported). In the FOSamax International Trial, Pols et al.84 reported a 47% risk reduction in non-vertebral fractures (95% CI 10% to 70%; p = 0.021) and, in the Cancer and Osteoporosis Research with Alendronate and Leuprolide (CORAL) trial, Klotz et al.73 reported no statistically significant difference in fractures (not described) between treatments (p-value 0.4395).

Two RCTs pooled fracture data from different alendronic acid dosing arms (licensed and unlicensed doses). Liberman et al.76 reported that by 36 months participants treated with alendronic acid (5 mg, 10 mg and 20 mg groups combined) had experienced fewer fractures than those treated with placebo (vertebral fractures: RR 0.52, 95% CI 0.28 to 0.95; p = 0.03; non-vertebral fractures: RR 0.79, 95% CI 0.52 to 1.22; p-value not reported). A difference between placebo and 10 mg per day of alendronic acid was reported for this RCT as an odds ratio (OR) of 0.45 (95% CI 0.18 to 1.13; p-value not reported);97 however, numbers by group were not reported. Saag et al.91 reported a difference in vertebral fractures at 12 months between the alendronic acid 5 mg and 10 mg groups combined and the placebo group as a RR of 0.6 (95% CI 0.1 to 4.4).

Ibandronic acid

Lester et al.,74 in the reversal of anastrozole (ARImidex) induced bone loss with oral monthly ibandronate (BONdronat) treatment during adjuvant therapy for breast cancer (ARIBON) trial,74 reported that three patients in placebo group and two patients in the ibandronic acid group (monthly oral dose) experienced fractures as AEs. McClung et al.80 also reported fractures as AEs, with 2% in placebo group and 3% in the ibandronic acid group (monthly oral dose) experiencing fractures. A difference between treatments was not reported by either RCT. In the BONE trial, Chesnut et al.45 reported that the risk of new vertebral fractures at 36 months was 62% lower in the group treated with 2.5 mg of oral ibandronic acid daily than the placebo-treated group (95% CI 41% to 74%; p = 0.0001). Clinical non-vertebral fractures were experienced by 8.2% of the placebo group compared with 9.1% of the group receiving 2.5 mg per day of oral ibandronic acid. A difference between treatments was not reported. In the DIVA trial, Delmas et al.49 reported that 43 (3.1%) participants experienced clinical fractures, including non-vertebral fractures recorded as AEs, at 12 months: 17 in the 2.5 mg per day of oral ibandronic acid group and 13 in the 3 mg i.v. every 3 months group. The corresponding numbers at the 24-month follow-up were 29 (6.2%) and 23 (4.9%).50 Differences between treatments were not reported. In the MOBILE trial, Miller et al.47 reported that there was no statistically significant difference between treatments in clinical fractures recorded as AEs at 12 months. At the 24-month follow-up, 24 (6.1%) participants receiving 2.5 mg per day of oral ibandronic acid and 27 (6.8%) receiving 150 mg per month had clinical fractures.48 Differences between treatments were not reported.

Risedronic acid

Boonen et al.58 reported no differences in new vertebral or clinical fractures (recorded as AEs) at 24 months between those treated with 35 mg per week of risedronic acid and those receiving placebo. Cohen et al.63 found no statistically significant difference in vertebral fractures in both men and women at 12 months between those treated with 5 mg per day of risedronic acid and those receiving placebo (p = 0.072). In the RCT assessing fractures as AEs,66 14% of the placebo group experienced vertebral fractures and 9% experienced non-vertebral fractures at 24 months. Corresponding numbers in the risedronic acid 5 mg per day group were 7% and 5%, respectively.66 A difference between treatments was not reported. The difference between treatments in new vertebral fractures or non-vertebral fractures between 5 mg per day of risedronic acid and placebo at 24 months was reported as not significant (p-value not reported) by one RCT.72

In the Vertebral efficacy with Risedronate Therapy – North American (VERT-NA) trial, Harris et al.70 reported a difference between treatments in favour of risedronic acid in the incidence of vertebral fractures at 36 months of 41% (95% CI 18% to 58%; p = 0.003) and in the incidence of non-vertebral fractures of 39% (95% CI 6% to 61%; p = 0.02). In the 60-month extension, fractures were recorded as AEs, the triallists reporting that AEs were similar across groups.99 A difference between treatments for fractures was not reported. In the Vertebral Efficacy with Risedronate Therapy – MultiNational (VERT-MN) trial, Reginster et al.85 reported a difference between treatment groups in fractures at the 36-month follow-up (vertebral fractures: RR 0.51, 95% CI 0.36 to 0.73; p < 0.001; non-vertebral fractures: RR 0.67, 95% CI 0.44 to 1.04; p = 0.063). In the extension study,100 a difference in vertebral fractures of 59% (95% CI 19% to 79%; p = 0.01) was reported. The triallists reported that fracture results observed in the study extension were consistent with those observed in the first 3 years.

In the subgroup of women aged 70–79 years, McClung et al.78 reported a difference in hip fractures at 12 months between those treated with 5 mg per day of risedronic acid and those treated with placebo (RR 0.7, 95% CI 0.4 to 1.1). In the subgroup of women aged ≥ 80 years, hip fracture data were reported for the combined 2.5 mg risedronic acid per day group (unlicensed) and the 5 mg risedronic acid per day group and compared with data for the placebo-treated group (p = 0.35). The hip fracture results in all women were also reported for the combined 2.5 mg risedronic acid per day group and 5 mg risedronic acid per day group and compared with the placebo-treated group, risedronic acid was favoured (RR 0.7, 95% CI 0.6 to 0.9; p = 0.02).

Reid et al.86 reported a p-value of 0.042 for the difference between treatments in vertebral fractures at 12 months across men and women for the 2.5 mg risedronic acid per day group and the 5 mg per day group combined compared with placebo. The difference between treatments for 5 mg risedronic acid per day compared with placebo was not reported. The triallists reported that the RCT was not powered to demonstrate fracture efficacy.

Ringe et al.89 reported a significant difference between treatment groups in new vertebral fractures at 12 months in men (p = 0.028). At 24 months, the significant difference persisted (p = 0.032).101

Zoledronic acid

In the HORIZON-PFT, Black et al.56 reported a difference in morphometrically assessed vertebral fractures at 36 months between women treated with 5 mg of zoledronic acid annually and those treated with placebo (RR 0.30, 95% CI 0.24 to 0.38; p < 0.001). The women were not taking any osteoporosis medications at baseline (stratum I). Significant between-group differences in hip fracture, non-vertebral fractures, clinical fractures and clinical vertebral fractures in all women were also reported (p < 0.001).

In the HORIZON-RFT, Lyles et al.77 reported a difference in any new clinical fracture at 36 months between men and women treated with 5 mg of zoledronic acid annually and those treated with placebo [hazard ratio (HR) 0.65, 95% CI 0.50 to 0.84; p = 0.001]. The difference in clinical non-vertebral fractures was reported as a HR of 0.73 (95% CI 0.55 to 0.98; p = 0.03), the difference in clinical hip fractures as a HR of 0.70 (95% CI 0.41 to 1.19; p = 0.18) and the difference in clinical wrist fractures as a HR of 0.72 (95% CI 0.56 to 0.93; p = 0.01).

Boonen et al.59 reported a difference in the number of male participants experiencing one or more new morphometric vertebral fractures at 24 months depending on treatment group (RR 0.33, 95% CI 0.16 to 07.70; p = 0.002).

Alendronic acid versus risedronic acid

In the Monthly Oral Therapy with Ibandronate for Osteoporosis iNtervention (MOTION) trial, Miller et al.,81 reported that, at 12 months, 18 out of 874 (2.1%) participants in the ibandronic acid group (monthly oral dose) had experienced osteoporotic fractures recorded as AEs, of which five were vertebral fractures and 14 non-vertebral, compared with 17 (comprising five vertebral and 12 non-vertebral) out of 859 (2%) participants in the alendronic acid group. A difference between treatments was not reported.

Muscoso et al.82 reported that at 24 months there were four fractures in the risedronic acid group, compared with none in the alendronic acid group; however, it was unclear if the unit of analysis was the participant or the fracture. A difference between treatments was not reported.

In the Fosamax Actonel Comparison Trial (FACT), Rosen et al.90 reported that at 12 months 5.0% of the alendronic acid group had an AE fracture, compared with 3.8% in the risedronic acid group. At 24 months, 8.3% of the alendronic acid group had an AE fracture, compared with 8.2% in the risedronic acid group.104 In the FACT international Study (FACTS), Reid et al.87 reported that at 12 months 3.6% of the alendronic acid group had an AE fracture, compared with 3.8% in the risedronic acid group. A difference between treatments was not reported. The corresponding values at 24 months105 were 5.7% and 6.3%.

Zoledronic acid versus risedronic acid

In the HORIZON trial, Reid et al.88 reported that the frequency of new vertebral fractures was five in the zoledronic acid group and three in the risedronic acid group, with no significant difference between drug groups. Data by steroid use subgroup were not reported.

Femoral neck bone mineral density

A total of 35 RCTs provided suitable femoral neck BMD data for inclusion in the NMA reported in Results from the network meta-analyses: 12 RCTs compared alendronic acid with placebo;53,55,57,64,65,67,68,73,76,83,84,91 one compared 2.5 mg per day of oral ibandronic acid with placebo;45 one compared 150 mg per month of oral ibandronic acid with placebo;80 one compared 2.5 mg per day of oral ibandronic acid with 3 mg i.v. ibandronic acid every 3 months;49 one compared 2.5 mg per day of oral ibandronic acid with 150 mg ibandronic acid per month;47 10 compared risedronic acid with placebo;58,62,63,66,70,72,75,85,86,95 four compared zoledronic acid with placebo;56,59,77,79 three compared alendronic acid with risedronic acid;87,90,92 one compared alendronic acid with 150 mg per month of oral ibandronic acid;81 and one compared zoledronic acid with risedronic acid.88

Alendronic acid

Statistically significant differences in femoral neck BMD between treatments for 10 mg per day of alendronic acid were reported at 48 weeks by one trial,91 at 12 months by three trials,65,71,84 at 24 months by four trials53,57,61,83 and at 36 months by three trials.55,64,76 The variance estimates were reported as a standard error in FIT I;55 however, FIT II64 reported that the variance estimates were SDs. These triallists were contacted for confirmation of the variance estimate (Professor Dennis Black, University of California, 2015, personal communication) but no reply was received to 29 June 2016. For this assessment report it was assumed that the femoral neck BMD variance estimate was reported as standard error in both RCTs because of the sample sizes and apparent comparability of the reported values. A mean difference between treatments at 24 months of 3.4% (95% CI 2.3% to 4.4%) was reported by one RCT67 (p-value not reported). One RCT did not report the difference between treatments at 36 months (data by group presented in graphical format only)68 and one RCT reported mean per cent change from baseline compared with age-matched and young adult reference values (source not reported).93 Significant changes from baseline were reported in the alendronic acid group (p < 0.01). One RCT reported differences between treatments in femoral neck T-scores and z-scores at 12 months,94 but no statistically significant differences between treatments were reported. One RCT assessing 70 mg per week of alendronic acid reported a mean change from baseline in femoral neck BMD at 12 months of –2.06% (SD ± 5.71%) in the placebo group, compared with 1.65% (SD ± 7.53%) in the alendronic acid group.73 No difference between treatments was reported by this RCT.73

Ibandronic acid

One RCT assessing 150 mg per month of ibandronic acid reported a mean change from baseline in femoral neck BMD at 12 months of –0.73% (SD ± 4.16%) in the placebo group compared with 1.09% (SD ± 2.87%) in the ibandronic acid group,80 but a between-group difference between treatments was not reported by this RCT. In the DIVA trial, Delmas et al.49 reported a mean change from baseline at 12 months of 1.6% (SD ± 4.18%) for 2.5 mg per day of oral ibandronic acid compared with 2.3% (SD ± 3.87%) for 3 mg of i.v. ibandronic acid every 3 months. Corresponding values at 24 months were 2.01% (SD ± 5.65%) and 2.32% (SD ± 4.70%);50 differences between treatments were not reported. In the MOBILE trial, Miller et al.47 reported a mean change in femoral neck BMD from baseline at 12 months of 1.71% (SD ± 3.68%) for 2.5 mg per day of oral ibandronic acid compared with 2.22% (SD ± 3.83%) for 150 mg per month of ibandronic acid. Corresponding values at 24 months were 1.91% (SD ± 4.45%) and 3.12% (SD ± 7.03%), respectively.48 Between-group differences between treatments were not reported.

Risedronic acid

Statistically significant differences in femoral neck BMD between women receiving 5 mg of risedronic acid per week and those receiving placebo were found at 12 months,75 24 months,66,72 36 months70,85 and 60 months.100 Statistically significant differences at 6 months95 and at 24 months58 were reported in men receiving 35 mg per week risedronic acid and at 12 months89 and 24 months in men receiving 5 mg per week risedronic acid compared with placebo treatment.101 One RCT reported a p-value of 0.4670 for 35 mg per week of risedronic acid, but it was unclear whether this was compared with baseline or the placebo group.62 One RCT reported a statistically significant difference at 12 months among men and women between those treated 5 mg per day of risedronic acid and those treated with placebo (p < 0.001);63 however, the difference between treatments was not significant when only women were considred.63 In a subgroup of women aged 70–79 years McClung et al.78 reported a 3.4% difference in femoral neck BMD between those treated with 5 mg per week of risedronic acid and those treated with placebo;78 data by group or a p-value were not reported. Reid et al.86 reported a p-value < 0.05 for 5 mg/day of risedronic acid in postmenopausal women compared with baseline.

Zoledronic acid

In the HORIZON-PFT, Black et al.56 reported a difference in femoral neck BMD between treatment groups at 36 months of 5.06% (95% CI 4.76% to 5.36%; p < 0.001). In the HORIZON-RFT trial, Lyles et al.77 also reported a statistically significant between-group difference at 36 months (p < 0.001). Boonen et al.59 reported a statistically significant between-group difference in men at 24 months (p < 0.05) and McClung et al.79 reported a statistically significant between-group difference in postmenopausal women at 24 months (p < 0.001).

Alendronic acid versus ibandronic acid

In the MOTION trial, Miller et al.81 reported a mean change in femoral neck BMD from baseline to 12 months of 2.1% (SD ± 1.77) in the 70 mg per week of alendronic acid group compared with 2.3% (± 2.12 SD) in the 150 mg per month oral ibandronic acid group; the difference between treatments was not reported.

Alendronic acid versus risedronic acid

In the RCT by Sarioglu et al.,92 data and variance estimates by group were reported. The triallists reported that the difference in femoral neck BMD between treatments was not significant (p-value or difference between treatments not reported). In the FACT trial, Rosen et al.90 reported that, at 12 months, the difference between treatments was 0.7% (95% CI 0.1% to 1.2%; p < 0.005) in favour of alendronic acid. The difference between treatments at 24 months104 was reported as 0.8% (95% CI 0.3% to 1.4%; p < 0.005) in favour of alendronic acid. In the FACTS trial, Reid et al.87 reported that, at 12 months, the difference between treatments was 0.56% (95% CI 0.03% to 1.09%; p = 0.039) in favour of alendronic acid. The difference between treatments at 24 months105 was reported as 1.0% (95% CI 0.3% to 1.6%; p = 0.002) in favour of alendronic acid.

Zoledronic acid versus risedronic acid

In the HORIZON trial, Reid et al.88 reported that, in the treatment subgroup, the difference in femoral neck BMD between treatments at 12 months was 1.06% (95% CI 0.32% to 1.79%) and the difference between treatments in the prevention subgroup was 1.33% (95% CI 0.41% to 2.25%); both were in favour of zoledronic acid.

Mortality

Details of all AEs reported for alendronic acid, ibandronic acid, risedronic acid and zoledronic acid, across all included RCTs, are presented in Appendix 4.

Nine RCTs45,55,56,58,59,64,77,81,88 reported deaths in participants treated with bisphosphonates: two RCTS compared 10 mg per day of alendronic acid with placebo;55,64 one compared 2.5 mg per day of ibandronic acid with placebo;45 one compared risedronic acid with placebo;58 four compared 5 mg per year of zoledronic acid with placebo;56,59,77,88 and one was a head-to-head comparison between alendronic acid and a monthly oral dose of ibandronic acid.81 The frequencies of deaths in each treatment group in the included RCTs are tabulated in Appendix 4.

Alendronic acid

Two RCTs55,64 reporting AEs in postmenopausal women for 24 months55 and 48 months64 were included. Data from the two RCTs show that there were 122 deaths: 61/3236 (1.9%) in the alendronic acid group and 61/3223 (1.9%) in the placebo group (pooled RR 1.0, 95% CI 0.70 to 1.41; p = 0.98). The difference between treatments was not statistically significant (Figure 6).

FIGURE 6. Deaths in postmenopausal women on alendronic acid compared with placebo.

FIGURE 6

Deaths in postmenopausal women on alendronic acid compared with placebo. M–H, Mantel–Haenszel.

Ibandronic acid

The BONE trial45 compared 2.5 mg per day of oral ibandronic acid (n = 977) with placebo (n = 975) for 36 months in postmenopausal women. No association between any treatment and risk of death was found. In total, 22 deaths occurred: 11 (1.1%) in the ibandronic acid group and 10 (1.0%) in the placebo group (RR 1.1, 95% CI 0.47 to 2.5; p = 0.83). The difference between treatments was not statistically significant (Figure 7).

FIGURE 7. Deaths in postmenopausal women on ibandronic acid compared with placebo.

FIGURE 7

Deaths in postmenopausal women on ibandronic acid compared with placebo. M–H, Mantel–Haenszel.

Risedronic acid

Boonen et al.58 compared 35 mg per week of risedronic acid with placebo in osteoporotic men (risedronic acid, n = 191; placebo, n = 93). After 24 months, there were five deaths: two (1%) in the risedronic acid group and three (3%) in the placebo group (RR 0.32, 95% CI 0.06 to 1.91; p = 0.21). The difference between treatments was not statistically significant (Figure 8).

FIGURE 8. Deaths of osteoporotic men on risedronic acid compared with placebo.

FIGURE 8

Deaths of osteoporotic men on risedronic acid compared with placebo. M–H, Mantel–Haenszel.

Zoledronic acid

Three RCTs reported mortality: Black et al.56 compared 5 mg of zoledronic acid with placebo in postmenopausal women at 36 months; Boonen et al.59 compared 5 mg of zoledronic acid with placebo in men for 36 months; and Lyles et al.77 compared 5 mg of zoledronic acid with placebo in men and women following hip fracture at 36 months. The pooled number of deaths across these RCTs was 517, of which 246 (out of 5504; 4.5%) were in the 5 mg of zoledronic acid groups and 271 (out of 5520 participants,4.9%) were in the placebo groups (pooled RR 0.91, 95% CI 0.77 to 1.08; p = 0.28). The difference between treatments was not statistically significant; however, the difference between treatments for the HORIZON-RFT77 alone was statistically significant (p = 0.007), with a higher mortality rate in the placebo arm (Figure 9).

FIGURE 9. Deaths of men or women on 5 mg per year of zoledronic acid compared with placebo.

FIGURE 9

Deaths of men or women on 5 mg per year of zoledronic acid compared with placebo. M–H, Mantel–Haenszel.

Head to head: zoledronic acid compared with risedronic acid

Reid et al.88 compared 5 mg of zoledronic acid per year with 5 mg per day of risedronic acid for 12 months in both men and women receiving steroids and divided the participants into treatment of osteoporosis and prevention of osteoporosis subgroups. In the treatment subgroup the RR of mortality for zoledronic acid compared with risedronic acid was 0.33 (95% CI 0.04 to 3.20; p = 0.34) and in the prevention subgroup the RR of mortality was 3.06 (95% CI 0.13 to 74.57; p = 0.49). The differences between treatments were not statistically significant. A forest plot is not presented for this comparison.

Head to head: alendronic acid compared with ibandronic acid

One head-to-head RCT in postmenopausal women, comparing 70 mg per week of alendronic acid (n = 859) with 150 mg per month of oral ibandronic acid (n = 874), reported mortality at 12 months.81 In total, six deaths were reported: two (0.2%) in the active treatment group and four (0.5%) in the placebo group (RR 0.51, 95% CI 0.09 to 2.77; p = 0.43) (Figure 10).

FIGURE 10. Head-to-head comparison of 70 mg of alendronic acid with 150 mg of ibandronic acid in postmenopausal women and deaths.

FIGURE 10

Head-to-head comparison of 70 mg of alendronic acid with 150 mg of ibandronic acid in postmenopausal women and deaths. M–H, Mantel–Haenszel.

Adverse effects of treatment

Details of all AEs reported for alendronic acid, ibandronic acid, risedronic acid and zoledronic acid, across all included RCTs, are presented in Appendix 4, Table 47.

A total of 30 of the included RCTs reported AEs;20,45,5559,64,6670,72,7681,8385,88,90,91,100,102,104,105 of these, 25 reported on any AE45,5559,66,67,69,70,72,7781,8385,87,88,90,91,104,105 and 19 reported on any serious AEs.45,5659,66,69,70,72,77,78,80,81,8385,87,88,90 Twenty RCTs reported the number of participants withdrawing because of AEs45,5558,64,66,69,70,72,7678,80,8385,87,88,90 and 20 reported data on upper GI events.45,5558,64,66,69,70,72,7678,80,8385,87,88,90 Six RCTs compared alendronic acid with placebo,55,57,64,67,83,84 six compared risedronic acid with placebo,58,66,70,72,78,85 one compared ibandronic acid (monthly oral dose) with placebo,80 one compared zoledronic acid with placebo,102 two compared alendronic acid with risedronic acid87,90 and one compared alendronic acid with zoledronic acid.69 A total of 10 RCTs reported influenza-like symptoms,56,58,59,69,77,7981,83,88 of which five evaluated zoledronic acid,56,59,77,79,88 one evaluated alendronic acid,83 one evaluated ibandronic acid (monthly oral dose)80 and one evaluated risedronic acid.58 Two RCTs reporting influenza-like symptoms were head-to-head comparisons of 70 mg per week of alendronic acid with 150 mg per month of ibandronic acid 81 and 70 mg per week of alendronic acid with 5 mg per year of zoledronic acid.69

Any adverse events, serious adverse events and withdrawals owing to adverse events
Alendronic acid.

Five RCTs reported any AE associated with 10 mg of alendronic acid and placebo in postmenopausal women treated for periods ranging from 12 to 36 months.55,57,67,84,91 Across these RCTs there were 3535 AEs; among participants on alendronic acid the incidence of AEs was 73.3% (1749/2384), compared with 76.5% (1786/2336) among those treated with placebo (pooled RR 0.98, 95% CI 0.90 to 1.06; p = 0.63). The difference between treatments was not statistically significant (Figure 11).

FIGURE 11. Any AE in the alendronic acid group compared with placebo.

FIGURE 11

Any AE in the alendronic acid group compared with placebo. M–H, Mantel–Haenszel.

Three RCTs reported the proportion of AEs that were considered serious in postmenopausal women.57,84,91 One reported events at 48 weeks,91 one at 12 months84 and one at 24 months.57 One RCT in osteoporotic men reported events at 24 months.83 Across the three RCTs in women, 205 serious AEs were observed: 103 (out of 1199 participants) in the alendronic acid groups (8.6%) and 102 (out of 1167 participants) in the placebo groups (8.7%) (pooled RR 0.96, 95% CI 0.74 to 1.25; p = 0.70). The difference between treatments was not statistically significant (Figure 12). In osteoporotic men, the number of AEs was not significantly different in different treatment groups (RR 0.80, 95% CI 0.48 to 1.32; p = 0.38).83

FIGURE 12. Any serious AE in the alendronic acid group compared with placebo.

FIGURE 12

Any serious AE in the alendronic acid group compared with placebo. M–H, Mantel–Haenszel.

Seven RCTs reported on withdrawals as a result of AEs.55,57,64,76,83,84,91 Across all RCTs the difference between treatments was not statistically significant. There were 807 withdrawals in total, and the incidence was 7.8% (376/4777) in the alendronic acid groups, compared with 8.8% (431/4882) in the placebo groups (pooled RR 0.86, 95% CI 0.73 to 1.07; p = 0.07). There was no statistically significant between-group difference across six RCTs in postmenopausal women55,57,64,84,91 ranging in duration from 48 weeks91 to 48 months.64 There were 793 withdrawals in total and the incidence was 8.0% (372/4631) in the alendronic acid groups, compared with 8.8% (421/4787) in placebo groups (pooled RR 0.90, 95% CI 0.79 to 1.03; p = 0.13). However, in osteoporotic men, placebo treatment was associated with a significantly higher rate of withdrawals at 24 months (10/95, 10.5%) than alendronic acid (4/146, 2.7%) (RR 0.26, 95% CI 0.08 to 0.81; p = 0.02).83 However, a statistically significant difference between treatments was not evident when RCTs were pooled by RCT duration (p = 0.68) (Figure 13).

FIGURE 13. Withdrawals as a result of an AE in the alendronic acid group compared with placebo.

FIGURE 13

Withdrawals as a result of an AE in the alendronic acid group compared with placebo. M–H, Mantel–Haenszel.

Ibandronic acid

Both Chesnut et al.45 and McClung et al.80 reported on the number of AEs of any type in an ibandronic acid group (unlicensed 2.5 mg daily oral dose45 and licensed monthly 150 mg oral dose80) and a placebo group. Both recruited postmenopausal women and follow-up duration was 36 months and 12 months, respectively. The proportion of participants who experienced any AE did not differ by treatment group. A total of 1870 participants experienced AEs, 939 (out of 1054 participants; 89.9%) in the ibandronic acid groups and 931 (out of 1058 participants; 88.0%) in the placebo groups (pooled RR 1.01, 95% CI 0.98 to 1.04; p = 0.45), and this did not vary by dosage of ibandronic acid (p = 0.99) (Figure 14).

FIGURE 14. Any AE in the ibandronic acid group compared with placebo.

FIGURE 14

Any AE in the ibandronic acid group compared with placebo. M–H, Mantel–Haenszel.

The same RCTs45,80 also reported the number of AEs that were considered serious. The difference between treatments across these trials was not statistically significant. A total of 449 participants experienced serious AEs: 237 (out of 1054 participants; 22.5%) in the ibandronic acid groups and 212 (out of 1058 participants; 20.0%) in the placebo groups (pooled RR 1.11, 95% CI 0.95 to 1.31; p = 0.20). The difference between treatments by dosage was also not statistically significant (Figure 15).

FIGURE 15. Any serious AE in the ibandronic acid group compared with the placebo group.

FIGURE 15

Any serious AE in the ibandronic acid group compared with the placebo group. M–H, Mantel–Haenszel.

The same RCTs also reported the number of withdrawals as a result of AEs.45,80 Overall, the proportion of withdrawals was similar among participants who were on ibandronic acid [17.8% (188/1054)] and those on placebo [17.6% (186/1058)] (374 AEs in total; pooled RR 1.24, 95% CI 0.56 to 2.75; p = 0.59). The difference between treatments across these RCTs was not statistically significant and results did not vary by ibandronic acid dosage (p = 0.17) (Figure 16).

FIGURE 16. Withdrawals as a result of an AE in the ibandronic acid group compared with the placebo group.

FIGURE 16

Withdrawals as a result of an AE in the ibandronic acid group compared with the placebo group. M–H, Mantel–Haenszel.

Risedronic acid

Six RCTs compared AEs in a risedronic acid-treated group and a placebo group.58,66,70,72,78,85 Five of these were in postmenopausal women, with treatment duration ranging from 12 to 24 months,66,70,72,78,85 and one was in osteoporotic men with a follow-up at 24 months.58 Pooled data across all six RCTs (8674 AEs) showed that the proportion of participants experiencing an AE was the same in the risedronic acid group [90.6% (4370/4821)] and the placebo group [90.5% (4304/4754)] (pooled RR 0.95, 95% CI 0.84 to 1.08; p = 0.44). The difference between treatments was not statistically significant and the results did not vary by age, sex, drug dosage (p = 0.67) or duration of follow-up (p = 0.64) (Figure 17).

FIGURE 17. Any AE in the risedronic acid group compared with the placebo group.

FIGURE 17

Any AE in the risedronic acid group compared with the placebo group. BMD-NA, Bone Mineral Density – North America trial; M–H, Mantel–Haenszel.

Pooled data from the same RCTs revealed that the proportions of participants experiencing serious AEs was also similar in both treatment groups; of the total of 2789 serious AEs reported, 1398 occurred in the risedronic acid group (of 4821 participants; 29.0%) and 1391 (of 4754 participants; 29.3%) in the placebo group (pooled RR 1.01, 95% CI 0.93 to 1.11; p = 0.76). The difference between treatments was not statistically significant. There were no statistically significant differences between treatments evident by age, sex or dosage (p = 0.27) or treatment duration (p = 0.18) (Figure 18).

FIGURE 18. Any serious AE in the risedronic acid group compared with the placebo group.

FIGURE 18

Any serious AE in the risedronic acid group compared with the placebo group. BMD-NA, Bone Mineral Density – North America trial; M–H, Mantel–Haenszel.

Pooled data from these six RCTs58,66,70,72,78,85 also showed that there were no statistically significant differences between treatments in withdrawals as a result of AEs [1596 withdrawals: 784 (of 4820 participants; 16.3%) in the risedronic acid group and 812 (of 4754 participants; 17.1%) in the placebo group (pooled RR 0.94, 95% CI 0.81 to 1.10; p = 0.45). However, the difference between treatments for the one RCT in osteoporotic men with follow-up at 24 months58 was statistically significant (p = 0.05) (Figure 19).

FIGURE 19. Withdrawals as a result of an AE in the risedronic acid group compared with placebo.

FIGURE 19

Withdrawals as a result of an AE in the risedronic acid group compared with placebo. BMD-NA, Bone Mineral Density – North America trial; M–H, Mantel–Haenszel.

Zoledronic acid

Four RCTs reported AEs for zoledronic acid compared with placebo.56,59,77,79 Two RCTs evaluated postmenopausal women who were followed up for 3656 and 24 months,79 one evaluated men and women with hip fracture who were followed up for 36 months77 and one RCT evaluated osteoporotic men who were followed up for 36 months.59

Pooled data across the two RCTs in postmenopausal women56,79 showed that zoledronic acid was associated with a statistically significant increase in the incidence of AEs (total 7663 AEs): the incidence was 94.5% (3861/4043) in the zoledronic acid group and 93.8% (3802/4054) in the placebo group (pooled RR 1.02, 95% CI 1.01 to 1.03; p = 0.0007). In one RCT in osteoporotic men,59 in which a total of 1000 AEs were reported, the incidence of AEs was 19% higher in the zoledronic acid group [90.8% (534 AEs in 588 participants)] than in the placebo group [76.3% (466 AEs in 611 participants) (RR 1.19, 95% CI 1.13 to 1.25; p < 0.00001]; the difference between treatments was statistically significant. Another RCT in men and women found no statistically significant difference between treatments.77 A total of 1719 AEs effects were reported, 867 (in 1054 participants; 82.3%) in the zoledronic acid group and 852 (in 1057 participants; 80.6%) in the placebo group (RR 1.02, 95% CI 0.98 to 1.02; p = 0.33). Pooled data across all four RCTs indicated that the incidence of AEs did not differ significantly by treatment group. The total number of AEs was 10,382, and 92.5% of study participants (5262/5685) treated with zoledronic acid group experienced an AE, compared with 89.5% of placebo-treated participants (5120/5722) (pooled RR 1.06, 95% CI 1.00 to 1.13; p = 0.06) (Figure 20).

FIGURE 20. Any AE in the zoledronic acid group compared with placebo.

FIGURE 20

Any AE in the zoledronic acid group compared with placebo. M–H, Mantel–Haenszel.

The number of serious AEs was reported by four RCTs.56,59,77,88 Across these RCTs the difference between treatments was not statistically significant. There were a total of 3427 serious AEs: 1679/5504 (30.5%) in the zoledronic acid groups and 1748/5520 (32.2%) in the placebo groups (pooled RR 0.96, 95% CI 0.91 to 1.02; p = 0.16). The incidence of serious AEs did not differ by sex (p = 0.86) or by RCT duration (p = 0.68) (Figure 21).

FIGURE 21. Any serious AE in the zoledronic acid group compared with placebo.

FIGURE 21

Any serious AE in the zoledronic acid group compared with placebo. M–H, Mantel–Haenszel.

Two RCTs reported data on withdrawals as a result of AEs.56,77 Pooled data across these RCTs showed that the rates of withdrawal were similar in the two treatment groups. There were a total of 189 withdrawals: 101/4961 (2.0%) in the 5 mg per year of zoledronic acid group and 88/4909 (1.8%) in the placebo groups (pooled RR 1.15, 95% CI 0.86 to 1.52; p = 0.35). The difference between treatments was not statistically significant. The number of withdrawals was the same for both sexes (p = 0.12) (Figure 22).

FIGURE 22. Withdrawals as a result of an AE in the zoledronic acid group compared with placebo.

FIGURE 22

Withdrawals as a result of an AE in the zoledronic acid group compared with placebo. M–H, Mantel–Haenszel.

Head to head: alendronic acid versus ibandronic acid

The MOTION trial81 compared 70 mg per week of alendronic acid with 150 mg per month of oral ibandronic acid in postmenopausal women for 12 months. The total number of AEs was 1291 and the proportion of participants experiencing an AE was higher in the alendronic acid group than in the ibandronic acid group [75.4% (659/859) versus 73.6% (632/874); RR 1.06, 95% CI 1.0 to 1.12; p = 0.04]; the difference between treatments was statistically significant (Figure 23).

FIGURE 23. Head-to-head comparison of alendronic acid with ibandronic acid and any AE.

FIGURE 23

Head-to-head comparison of alendronic acid with ibandronic acid and any AE. M–H, Mantel–Haenszel.

Head to head: alendronic acid versus risedronic acid

Two RCTs compared 70 mg per week of alendronic acid with 35 mg per week of risedronic acid in postmenopausal women treated for 12 months.87,90 Pooled data across these RCTs indicate that the risk of AEs was similar in both groups. The total number of AEs was 1413 and the proportion of participants experiencing an AE was 71.2% (700/983) in the alendronic acid group and 71.7% (713/995) in the risedronic acid group (pooled RR 1.0, 95% CI 0.94 to 1.05; p = 0.93); the difference between treatments was not statistically significant (Figure 24).

FIGURE 24. Head-to-head comparison of alendronic acid with risedronic acid and any AE.

FIGURE 24

Head-to-head comparison of alendronic acid with risedronic acid and any AE. M–H, Mantel–Haenszel.

Head to head: alendronic acid versus zoledronic acid

The Rapid Onset and Sustained Efficacy (ROSE) trial69 compared 70 mg per week of alendronic acid with 5 mg per year of zoledronic acid. The total number of AEs was 465 and the risk of AEs was similar in the two treatment groups [74.7% (145/194) in the alendronic acid group, compared with 78.4% (320/408) in the zoledronic acid group; RR 0.95, 95% CI 0.87 to 1.05; p = 0.33]; the difference between treatments was not statistically significant (Figure 25).

FIGURE 25. Head-to-head comparison of alendronic acid with zoledronic acid and any AE.

FIGURE 25

Head-to-head comparison of alendronic acid with zoledronic acid and any AE. M–H, Mantel–Haenszel.

Head to head: zoledronic acid versus risedronic acid

The HORIZON trial88 compared 5 mg per year of zoledronic acid with 5 mg per day of risedronic acid in both men and women receiving steroids; the participants were divided into treatment and prevention subgroups for 12 months. The difference between treatments in any AE in the treatment subgroup was a RR of 1.14 (95% CI 1.06 to 1.26; p = 0.01) and the difference between treatments in the prevention subgroup was a RR of 1.19 (95% CI 1.03 to 1.26; p = 0.01), with more AEs in the zoledronic acid groups in both cases. The differences between treatments were statistically significant. No forest plot is presented for these data.

Serious adverse events
Head to head: alendronic acid versus ibandronic acid

The MOTION trial81 also reported the number of AEs experienced by participants receiving weekly alendronic acid (n = 859) or monthly oral ibandronic acid (150 mg/month) (n = 874). There were 94 serious AEs and the risk of experiencing a serious AE was similar in the two groups [4.5% (39/859) in the alendronic acid group and 6.4% (55/874) in the ibandronic acid group; RR 0.72, 95% CI 0.48 to 1.08; p = 0.11]. The difference between treatments was not statistically significant (Figure 26).

FIGURE 26. Head-to-head comparison of alendronic acid with ibandronic acid and any serious AE.

FIGURE 26

Head-to-head comparison of alendronic acid with ibandronic acid and any serious AE. M–H, Mantel–Haenszel.

Head to head: alendronic acid versus risedronic acid

Pooled data across two RCTs87,90 indicate no statistically significant difference in the incidence of serious AEs between the two treatments [157 serious AEs; 7.0% (69/983) in the alendronic acid group and 8.8% (88/995) in the risedronic acid group; RR 0.76, 95% CI 0.35 to 1.66; p = 0.50] (Figure 27).

FIGURE 27. Head-to-head comparison of alendronic acid with risedronic acid and any serious AE.

FIGURE 27

Head-to-head comparison of alendronic acid with risedronic acid and any serious AE. M–H, Mantel–Haenszel.

Head to head: alendronic acid versus zoledronic acid

In the ROSE trial,69 the proportion of participants experiencing a serious AE was not significantly different between the group receiving 70 mg per week of alendronic acid and the group receiving 5 mg per year of zoledronic acid [64 serious AEs: 21/194 (10.8%) in the alendronic acid group and 43/403 (10.5%) in the zoledronic acid group; RR 1.03, 95% CI 0.63 to 1.68, p = 0.92] (Figure 28).

FIGURE 28. Head-to-head comparison of alendronic acid with zoledronic acid and any serious AE.

FIGURE 28

Head-to-head comparison of alendronic acid with zoledronic acid and any serious AE. M–H, Mantel–Haenszel.

Head to head: zoledronic acid versus risedronic acid

In the HORIZON trial,88 in which men and women receiving steroids were divided into treatment and prevention subgroups for 12 months, the difference between treatments in serious AEs in the treatment subgroup was a RR of 0.93 (95% CI 0.66 to 1.31; p = 0.68) and the difference between treatments in the prevention subgroup was a RR of 1.13 (95% CI 0.68 to 1.88; p = 0.64). The differences between treatments were not statistically significant. No forest plot is presented for these data.

Withdrawals as a result of adverse events
Head to head: alendronic acid versus risedronic acid

Two RCTs reported withdrawals as a result of AEs.87,90 Pooled data across these RCTs indicate no statistically significant difference between treatments [114 withdrawals: 53/983 (5.4%) in the alendronic acid group and 61/995 (6.1%) in the risedronic acid group; pooled RR 0.88, 95% CI 0.62 to 1.26; p = 0.50] (Figure 29).

FIGURE 29. Head-to-head comparison of alendronic acid with risedronic acid and withdrawals as a result of AEs.

FIGURE 29

Head-to-head comparison of alendronic acid with risedronic acid and withdrawals as a result of AEs. M–H, Mantel–Haenszel.

Head to head: alendronic acid versus zoledronic acid

The difference between treatments in withdrawals as a result of AEs was statistically significant for one trial69 comparing 70 mg per week of alendronic acid with 5 mg per year of zoledronic acid [21 withdrawals: 19/194 (9.8%) in the alendronic acid group and (2/408 (0.5%) in the zoledronic acid group; RR 19.98, 95% CI 4.70 to 84.92; p < 0.0001] (Figure 30).

FIGURE 30. Head-to-head comparison of alendronic acid with zoledronic acid and withdrawals as a result of AEs.

FIGURE 30

Head-to-head comparison of alendronic acid with zoledronic acid and withdrawals as a result of AEs. M–H, Mantel–Haenszel.

Head to head: zoledronic acid versus risedronic acid

In the HORIZON trial,88 in which men and women receiving steroids were divided into treatment and prevention subgroups for 12 months, the difference between treatments in the number of withdrawals as a result of AEs was a RR of 1.00 (95% CI 0.20 to 4.93; p = 1.00) in the treatment subgroup and a RR of 2.00 (95% CI 0.51 to 7.84; p = 0.32) in the prevention subgroup; the differences between treatments were not statistically significant. No forest plot is presented for these data.

Any upper gastrointestinal adverse events

The types of upper GI events greatly varied in different RCTs. Among six RCTs55,57,64,76,83,84 that investigated alendronic acid and reported specific AEs (1738 upper GI events), abdominal pain was the most common, accounting for 32% (557/1738) of all upper GI events, followed by acid regurgitation at 17.5% (304/1738), dyspepsia at 11.2% (195/1738) and nausea at 8.1% (140/1738). Other events included peptic ulcers (i.e. oesophageal and stomach ulcers), gastritis, oesophagitis, belching, diarrhoea, dysphagia, constipation, heartburn and gastroenteritis.

In the six RCTs that administered 5 mg of risedronic acid (1076 upper GI events),66,70,72,78,85 abdominal pain was also the most common, accounting for 43.1% (464/1076) of all upper GI events, followed by dyspepsia (38.9%, 419/1076), oesophagitis (7.6%, 82/1076) and gastritis (4.0%, 43/1076). Similar results were observed in the BONE trial45 and the trial by McClung et al.,80 in which abdominal pain and dyspepsia were the most common upper GI events, accounting for 11.4% (111/977) of upper GI events in the group receiving 5 mg ibandronic acid daily and 31.2% (24/77) in the group receiving 150 mg ibandronic acid monthly. Of the 300 upper GI events occurring in participants on 5 mg of zoledronic acid in two RCTs,88,102 nausea was the major event, with 168 reports (56.0%), followed by vomiting with 76 (25.3%), diarrhoea with 67 (22.3%), abdominal pain with 48 (16.0%) and anorexia with 45 (15.0%). However, the proportion of these upper GI events was similar in the treatment group and the placebo group, but less frequent in the zoledronic acid group.102

Alendronic acid

Six RCTs reporting upper GI AEs evaluated 10 mg per day of alendronic acid in postmenopausal women55,57,64,67,84,91 and one investigated 10 mg per day of alendronic acid in men with osteoporosis.83

Pooled data across all seven RCTs indicated no statistically significant difference between treatments in the incidence of upper GI AEs. There were a similar incidence of upper GI events reported in patients receiving alendronic acid (38.6%) and placebo (37.6%) when pooling data across trials (pooled RR 1.03, 95% CI 0.98 to 1.08; p = 0.30) (Figure 31). There was also no statistically significant difference between treatments according to sex (see Figure 31) or RCT duration (p = 0.83).

FIGURE 31. Any upper GI AEs in the alendronic acid group compared with placebo.

FIGURE 31

Any upper GI AEs in the alendronic acid group compared with placebo. M–H, Mantel–Haenszel; UGI, upper GI.

Ibandronic acid

Only one trial80 using ibandronic acid reported upper GI events. The difference between treatments was not statistically significant [44 upper GI events: 24/77 (31.2%) in the ibandronic acid (monthly oral dose) group and 20/83 (24.1%) in the placebo group; RR 1.29 95% CI 0.78 to 2.15; p = 0.32] (Figure 32).

FIGURE 32. Any upper GI AEs in the ibandronic acid group compared with placebo.

FIGURE 32

Any upper GI AEs in the ibandronic acid group compared with placebo. M–H, Mantel–Haenszel; UGI, upper GI.

Risedronic acid

Five RCTs evaluated 5 mg per day of risedronic acid in postmenopausal women66,70,72,78,85 and one evaluated 35 mg per week of risedronic acid in osteoporotic men.58 Pooled data across the five RCTs in postmenopausal women showed that the overall risk of upper GI AEs was similar in the two treatment groups [2150 upper GI events: 1076/4630 (23.2%) in the risedronic acid group and 1074/4661 (23.0%) in the placebo group; pooled RR 1.04, 95% CI 0.97 to 1.13; p = 0.75]. The difference between treatments was not statistically significant. Pooled results across all the six RCTs showed that there was no statistically significant difference between treatments in upper GI events in the risedronic acid treatment group or placebo [2183 upper GI events; 1092/4821 (22.7%) in the risedronic acid group and 1091/4754 (22.9%) in the placebo group; RR 0.99, 95% CI 0.87 to 1.14; p = 0.93] and this did not vary with RCT duration (p = 0.45). However, in the RCT in osteoporotic men,58 in which 33 upper GI events were reported, the risk was significantly higher (16/191, 8.4%) in the risedronic acid group than in the placebo group (19/93, 20.4%) (RR 0.46, 95% CI 0.24 to 0.87; p = 0.02) (Figure 33).

FIGURE 33. Any upper GI AEs in the risedronic acid group compared with placebo.

FIGURE 33

Any upper GI AEs in the risedronic acid group compared with placebo. M–H, Mantel–Haenszel; UGI, upper GI.

Alendronic acid versus risedronic acid

Pooled data across two RCTs87,90 revealed no statistically significant difference in the number of upper GI events between the alendronic acid treatment group and the risedronic acid treatment group [411 upper GI events: 211/983 (21.5%) in the alendronic acid group and 00/995 (20.1%) in the risedronic acid group; pooled RR 1.07, 95% CI 0.90 to 1.27; p = 0.45] (Figure 34).

FIGURE 34. Any upper GI AEs in the alendronic acid group compared with the risedronic acid group.

FIGURE 34

Any upper GI AEs in the alendronic acid group compared with the risedronic acid group. M–H, Mantel–Haenszel; UGI, upper GI.

Alendronic acid versus zoledronic acid

One RCT reporting upper GI events as an outcome69 found a significantly higher incidence of upper GI events in the 70 mg per week alendronic acid treatment group than in the 5 mg per year zoledronic acid group [132 upper GI events: 57/194 (29.4%) in the alendronic acid group, compared with 75/408 (18.4%) in the zoledronic acid group; RR 1.60, 95% CI 1.19 to 2.16; p = 0.002] (Figure 35).

FIGURE 35. Any upper GI AEs in the alendronic acid group compared with the zoledronic acid group.

FIGURE 35

Any upper GI AEs in the alendronic acid group compared with the zoledronic acid group.

Head to head: zoledronic acid versus risedronic acid

The HORIZON trial88 compared 5 mg per year of zoledronic acid with 5 mg per day of risedronic acid in both men and women receiving steroids and divided the participants into treatment and prevention subgroups for 12 months. The p-values for the differences between treatments in upper GI AEs reported between the treatment subgroup were as follows: upper abdominal pain, p = 0.158; abdominal pain, p = 0.16; dyspepsia, p = 0.70; nausea, p = 0.19; vomiting, p = 0.04; gastritis, p = 0.68; and gastro-oesophageal reflux, p = 0.37. The p-values for the differences between treatments reported between the prevention subgroup were as follows: upper abdominal pain, p = 1.00; abdominal pain, p = 1.00; dyspepsia, p = 0.57; nausea, p = 0.52; vomiting, p = 1.00; gastritis, p = 1.00; and gastro-oesophageal reflux, p = 0.44.

Any gastrointestinal event
Zoledronic acid

In HORIZON-PFT102 the proportion of participants experiencing any GI event (abdominal pain, anorexia, diarrhoea, nausea, vomiting) in the first 3 days following i.v. administration was significantly higher in the zoledronic acid group than in the placebo group [380 GI events: 300/3862 (7.8%) in the zoledronic acid group and 80/3852 (2.1%) in the placebo group; RR 3.74, 95% CI 2.93 to 4.77; p < 0.00001] (Figure 36).

FIGURE 36. Any GI AEs in the zoledronic acid group compared with placebo.

FIGURE 36

Any GI AEs in the zoledronic acid group compared with placebo. M–H, Mantel–Haenszel; UGI, upper GI.

Influenza-like symptoms

The reporting of influenza-like symptoms, including upper respiratory infections, influenza, pyrexia, headache, chills, nasopharyngitis, bronchitis, pneumonia, cough and fatigue, varied across RCTs. Some RCTs reported only the occurrence of influenza-type symptoms, whereas others documented a number of potentially associated symptoms.

Alendronic acid

One RCT83 reported the incidence of influenza-like symptoms in osteoporotic men: 146 treated with alendronic acid and 95 treated with placebo.83 Overall, 113 participants experienced influenza-like symptoms [66/146 (45.2%) in the alendronic acid group and 47/95 (49.5%) in the placebo group; RR 0.91, 95% CI 0.70 to 1.20; p = 0.51]. The difference between treatments was not statistically significant.

Ibandronic acid

In the RCT by McClung et al.,80 4.8% (4/83) of participants receiving 150 mg per month of oral ibandronic acid developed influenza-like symptoms, whereas none of the 83 (0%) participants receiving placebo developed symptoms. The difference between treatments was not statistically significant (p = 0.12).

Risedronic acid

Boonen et al.58 reported the number of participants treated with 35 mg per week of risedronic acid or placebo who developed influenza and nasopharyngitis. The differences between treatment groups were not statistically significant. There were 15 influenza cases: 11 (among 191 participants, 5.8%) in the risedronic acid group and five (among 93 participants, 5.4%) in the placebo group (RR 1.07, 95% CI 0.38 to 2.99; p = 0.90). There were also 15 cases of nasopharyngitis: 11/191 (5.8%) in the risedronic acid group and 5/93 (5.4%) in the placebo group (RR 1.07, 95% CI 0.38 to 2.99; p = 0.90).

Zoledronic acid

Five of the included RCTs using zoledronic acid reported on influenza-like symptoms.56,59,77,79,88 Across these RCTs, zoledronic acid was associated with a significantly higher incidence of pyrexia, headache and chills than placebo. There were 1048 reports of pyrexia: 907 (in 5957 participants, 15.2%) in the zoledronic acid group and 141 (among 5866 participants, 2.4%) in the placebo group (pooled RR 4.36, 95% CI 1.91 to 9.98; p < 0.0005) (Figure 37). There were 554 cases of headache: 405 (among 4903 participants, 8.3%) in the zoledronic acid group and 149 (among 4809 participants, 3.1%) in the placebo group (pooled RR 2.14, 95% CI 1.36 to 3.39; p = 0.001) (Figure 38). There were 53 reports of chills: 44/453 (9.7%) in the zoledronic acid group and 9/346 (2.6%) in the placebo group (pooled RR 3.81, 95% CI 1.25 to 11.60, p < 0.02) (Figure 39). The incidence of pyrexia and headache significantly differed by sex (p < 0.00001 and p = 0.004, respectively).

FIGURE 37. Pyrexia: zoledronic acid compared with placebo.

FIGURE 37

Pyrexia: zoledronic acid compared with placebo. M–H, Mantel–Haenszel.

FIGURE 38. Headache: zoledronic acid compared with placebo.

FIGURE 38

Headache: zoledronic acid compared with placebo. M–H, Mantel–Haenszel.

FIGURE 39. Chills: zoledronic acid compared with placebo.

FIGURE 39

Chills: zoledronic acid compared with placebo. M–H, Mantel–Haenszel.

Alendronic acid versus ibandronic acid

In the MOTION trial,81 the incidence of neither influenza nor nasopharyngitis differed significantly between treatment groups [influenza (85 events): 36 (among 859 participants, 4.2%) in the alendronic acid group and 49 (among 874 participants, 5.6%) in the ibandronic acid group (monthly oral dose, 150 mg) (RR 0.75, 95% CI 0.49 to 1.14; p = 0.17); nasopharyngitis (92 events): 41 among 859 participants, 4.8%) in the alendronic acid group and (51 among 874 participants, 5.8%) in the ibandronic acid group (RR 0.82, 95% CI 0.55 to 1.22; p = 0.33)].

Alendronic acid versus zoledronic acid

The ROSE trial69 found that 5 mg per year of zoledronic acid was associated with significantly more influenza-like symptoms than 70 mg per week of alendronic acid [137 cases: 5/194 (2.6%) in the alendronic acid group and 132/408 (32.4%) in the zoledronic acid group; RR 1.44, 95% CI 1.34 to 1.55; p < 0.00001]. It was also associated with a slight increase in pyrexia [23 cases: 2/194 (1.0%) in the alendronic acid group and 21/408 (5.2%) in the zoledronic acid group; RR 1.04, 95% CI 1.02 to 1.07; p = 0.002] and an increase in chills [26 cases: 3/194 (1.5%) in the alendronic acid group and 13/408 (3.2%) in the zoledronic acid group; RR 1.02, 95% CI 0.99 to 1.04; p = 0.19] (Figure 40).

FIGURE 40. Influenza-like symptoms: 70 mg per week of alendronic acid compared with 5 mg per year of zoledronic acid.

FIGURE 40

Influenza-like symptoms: 70 mg per week of alendronic acid compared with 5 mg per year of zoledronic acid.

Head to head: zoledronic acid compared with risedronic acid

The HORIZON trial88 compared 5 mg per year of zoledronic acid with 5 mg per day of risedronic acid in both men and women receiving steroids, and divided the participants into treatment and prevention subgroups for 12 months. The difference between treatments in influenza-like symptoms in the treatment subgroup was a RR of 5.02 (95% CI 1.47 to 17.14; p = 0.01) and the difference between treatments in the prevention subgroup was a RR of 10.00 (95% CI 1.30 to 77.09; p = 0.03); the differences between treatments were statistically significant (more events with zoledronic acid). No forest plot is presented for these data.

Risk of hospitalisation
Alendronic acid

Three RCTs in postmenopausal women reported on hospitalisation.55,64,68 A total of 1850 participants were hospitalised during 36 months55,68 or 48 months of follow-up.64 Across these RCTs there was no statistically significant difference in the risk of hospitalisation between participants receiving alendronic acid (27.9%, 928/3329) than those on placebo (27.8%, 922/3316) (pooled RR 1.01, 95% CI 0.79 to 1.28; p = 0.96) (Figure 41).

FIGURE 41. Forest plot for hospitalisation in postmenopausal women on 10 mg per day of alendronic acid compared with placebo.

FIGURE 41

Forest plot for hospitalisation in postmenopausal women on 10 mg per day of alendronic acid compared with placebo.

Atrial fibrillation

Atrial fibrillation was reported as an AE outcome across the two HORIZON RCTs comparing zoledronic acid with placebo56,77 and in the HORIZON RCT in men and women receiving glucocorticoids.88 Across these RCTs no statistically significant differences between treatments were evident [HORIZON-PFT: RR 1.28 (95% CI 0.95 to 1.74; p = 0.10); HORIZON-RFT: RR 1.21 (95% CI 0.80 to 1.85; p= 0.37); HORIZON glucocorticoid – prevention group: RR 7.00 (95% CI 0.36 to 134.31; p= 0.20); HORIZON glucocorticoid – treatment group: zero events in both arms]. No forest plot is presented for these data.

Bone pain

Bone pain was reported as an AE outcome by two RCTs.69,88

Head to head: zoledronic acid compared with risedronic acid

The HORIZON trial88 compared 5 mg per year of zoledronic acid with 5 mg per day of risedronic acid in both men and women receiving steroids, and divided the participants into treatment and prevention subgroups for 12 months. The difference between treatments in bone pain in the treatment subgroup was a RR of 2.61 (95% CI 0.94 to 7.22; p = 0.06). The difference between treatments was not statistically significant. There were zero events in both arms of the prevention subgroup. No forest plot is presented for these data.

Head to head: alendronic acid compared with zoledronic acid

The ROSE RCT69 compared 70 mg per week of alendronic acid with 5 mg per year of zoledronic acid. The difference between treatments in bone pain was a RR of 6.91 (95% CI 3.02 to 15.83; p < 0.00001). The difference between treatments was statistically significant (more events with zoledronic acid). No forest plot is presented for these data. There were zero events in both arms of the prevention subgroup.

Conjunctivitis
Zoledronic acid

The HORIZON-PFT102 reported on eye inflammation as an AE in the first 3 days following administration of 5 mg per year of zoledronic acid or placebo in osteoporotic women. The difference between treatments in eye inflammation was a RR of 6.98 (95% CI 1.59 to 30.70; p = 0.01). The difference between treatments was statistically significant (more events with zoledronic acid). No forest plot is presented for these data.

Stroke
Zoledronic acid

The HORIZON-RFT77 reported on stroke as an AE in men and women with history of hip fracture receiving 5 mg per year of zoledronic acid or placebo over 5 years. The difference between treatments in stroke was a RR of 1.21 (95% CI 0.80 to 1.85; p = 0.37); the difference between treatments was not statistically significant. No forest plot is presented for these data.

Osteonecrosis of the jaw
Zoledronic acid

Four placebo-controlled RCTs evaluated zoledronic acid,56,59,77,79 one compared zoledronic acid with risedronic acid88 and one compared zoledronic acid with alendronic acid;69 all studies reported that no cases of spontaneous osteonecrosis were observed during the course of the RCT. The HORIZON-PFT56 reported that cases of osteonecrosis in both the zoledronic acid and placebo groups following dental surgery (one case in each group) resolved with antibiotic therapy.

Hypocalcaemia and atypical femoral fracture

None of the included RCTs reported on these AE outcomes.

Systematic review evidence for adverse events

A supplementary search in MEDLINE (via Ovid) and EMBASE (via Ovid) for systematic reviews reporting AEs of treatment was undertaken on 6 January 2015. Keywords and subheadings for AEs and safety with the drug names, and a reviews search filter were used. The MEDLINE search strategy is presented in Appendix 1. A total of 177 additional citations were identified, which were then sifted by a single reviewer (FC). Fourteen reviews summarising evidence for AEs across studies in bisphosphonates were identified.112125 A summary of these reviews and their findings is presented in Table 48, Appendix 5.

Any AE/upper gastrointestinal events

The review by Bobba et al.112 evaluated the evidence from 14 studies of alendronic acid, eight studies of risedronic acid, 10 studies of ibandronic acid and nine studies in zoledronic acid. RCTs and observational studies were included. Summarising the evidence base, the reviewers reported that the rates of GI toxicity associated with alendronic acid, risedronic acid and oral ibandronic acid are similar to those associated with placebo. In addition, no significant difference in renal toxicity was evident for i.v. ibandronic acid compared with placebo; however, a decrease in renal function was evident with zoledronic acid. Osteonecrosis of the jaw was rarely described in participants receiving oral bisphosphonates, but it was more commonly reported in participants with malignancy receiving zoledronic acid. The authors concluded that the AEs associated with alendronic acid, risedronic acid and oral ibandronic acid are minimal; however, zoledronic acid may be compromised by renal toxicity. Myalgias and arthralgias were evident in the acute phase following i.v. administration.

In a review of clinical efficacy of risedronic acid for postmenopausal osteoporosis, Paget’s disease, breast cancer and participants taking glucocorticoids, Crandall113 evaluated the evidence across nine RCTs and seven clinical trials. Safety data from six RCTs of risedronic acid for any condition indicated that the safety of risedronic acid is similar to that of placebo; none of the trials found a notable rate of upper GI AEs.

In a comparative review of pivotal trials of alendronic acid and risedronic acid including a meta-analysis, Kherani et al.114 concluded that both alendronic acid and risedronic acid result in similar rates of AEs as placebo.

In a review of clinical studies and review articles concerning the use of risedronic acid, Umland and Boyce115 observed that, although post-marketing surveillance studies reported an increase in serious or severe upper GI side effects with alendronic acid, similar findings were not evident for risedronic acid. The reviewers concluded that risedronic acid has been associated with a lower incidence of gastric ulcers than alendronic acid; however, the number of AEs associated with risedronic acid is generally similar to those observed with placebo in most clinical trials.

As part of a NICE report on adverse effects and persistence with oral bisphosphonates, Lloyd-Jones and Wilkinson116 reported that across UK prescription event monitoring studies, treatment with daily alendronic acid or risedronic acid is associated with a high level of reporting of a number of conditions in the first month of therapy, particularly those affecting the upper GI tract. There were around 30 reports of dyspepsia, the most commonly reported condition, per 1000 patient-months of exposure. However, RCTs of tolerability found no increased incidence of AEs in patients randomised to alendronic acid.

The Actavis consultee submission for this assessment reported that the patients who switched from risedronic acid to alendronic acid experienced a significant increase in the risk of GI side effects. In a retrospective cohort study evaluating anonymous medical records from 390 general practices in the UK, Ralston et al.126 reported that the risk of developing a GI AE was higher in patients who switched to alendronic acid than in those who remained on risedronic acid (HR 1.85, 95% CI 1.26 to 2.72). The authors also reported that the risk was even greater in the subgroup of patients with a history of upper GI events (HR 3.18, 95% CI 2.79 to 3.63), but was also observed in patients with no history of GI events (HR 1.76, 95% CI 1.15 to 2.69). The authors concluded that switching patients who are stabilised on risedronic acid to alendronic acid is associated with an increased risk of GI AEs.

Osteonecrosis of the jaw

In a review specifically of bisphosphonate-induced osteonecrosis of the jaw, Krueger et al.117 reviewed the evidence from 11 case reports and 26 case series studies reporting actual cases linking osteonecrosis of the jaw with bisphosphonate use, the majority of which reported on zoledronic acid. The available literature showed that i.v. bisphosphonates, especially zoledronic acid, are more likely to predispose patients to osteonecrosis of the jaw. However, in addition to bisphosphonate use, there appears to be several other factors involved in the development of osteonecrosis of the jaw. Other risk factors noted from the included studies were dental extraction or trauma to the jaw exposing part of the bone.

Van den Wyngaert et al.118 also reviewed the evidence of an asssociation between bisphosphonates and osteonecrosis of the jaw across 22 studies based on retrospective chart reviews without a control, of which three included patients with osteoporosis. Zoledronic acid and pamidronic acid (Aredia®, Novartis Pharmaceuticals Ltd) were the main bisphosphonates covered. Of the patients included in the studies, 69.3% had undergone a dental extraction prior to the development of osteonecrosis, confirming the importance of trauma in the initiation of the disease. However, not enough evidence is available to prove a causal link.

Woo et al.119 reviewed the evidence of a link between bisphosphonates and osteonecrosis of the jaw across 29 case reports. Zoledronic acid, aledronic acid and pamidronic acid were the main bisphosphonates covered and 94% of patients were treated with zoledronic acid or pamidronic acid or both; 85% of affected patients had multiple myeloma or metastatic breast cancer and 4% had osteoporosis. The authors concluded that the prevalence of osteonecrosis in patients with cancer is 6–10% and the prevalence in those taking alendronic acid for osteoporosis is unknown. The authors also concluded that more than half of all cases (60%) occur after dentoalveolar surgery (such as tooth extraction) to treat infections, and the remaining 40% are probably related to infection, denture trauma or other physical trauma.

Recently, Lee et al.120 undertook a meta-analysis of 12 cohort and case–control studies evaluating oral and i.v.-administered bishphosphonates. An inclusion criterion was that the studies were carried out in non-cancer patients. The pooled effect estimate indicated that the use of bisphosphonates was associated with a significantly increased risk of jaw osteonecrosis (OR 2.32, 95% CI 1.38 to 3.91). The reviewers concluded that the use of bisphosphonates in non-cancer patients is associated with a substantial risk of jaw osteonecrosis and that patients receiving i.v. bisphosphonates are at highest risk.

Atypical fracture

Giusti et al.121 reviewed the evidence from 39 publications reporting on women treated with a bisphosphonate in a regimen used for the prevention or treatment of osteoporosis. Twenty-seven of the publications were case series or case reports (one abstract), four were retrospective studies and one was a prospective article including three new cases. In most cases, the bisphosphonate was alendronic acid, prescribed for prevention or treatment of osteoporosis. Across the included studies, there were 58 femoral shaft fractures and 41 subtrochanteric fractures; the precise fracture site was not specified in 42 cases. Nineteen fractures were diagnosed at presentation as insufficiency fractures, with 12 of these progressing to a complete fracture. Overall, 53 (44.2%) of the 120 patients for whom data were available had a contralateral fracture (32 of which were insufficiency fractures), either concurrently with or subsequent to the initial fracture, of which 34 (64.2%) occurred in the same anatomical location as the first fracture. The authors concluded that the analysis allowed the clinical identification of patients at risk of developing atypical fractures; however, the reviewers also concluded that long-term bisphosphonate therapy is not a prerequisite for development of atypical fractures. Moreover, the use of glucocorticoids and proton pump inhibitors is an important risk factor for atypical fracture.

Recently, Gedmintas et al.122 undertook a meta-analysis of atypical fractures reported in five case–control studies and six cohort studies. The studies were mainly carried out in women and evaluated mainly alendronic acid but also ibandronic acid, risedronic acid, zoledronic acid and other bisphosphonates. The overall pooled estimate for atypical fractures associated with bisphosphonates using data from the five case–control and six cohort studies was a RR of 1.70 (95% CI 1.22 to 2.37). Gedmintas et al.122 concluded that there is an increased risk of atypical fracture among bisphosphonate users but that atypical fractures are rare events, even in bisphosphonate users.

Oesophageal cancer

Andrici et al.123 undertook a meta-analysis of seven cohort or case–control studies investigating oral bisphosphonates and the risk of oesophageal cancer. Participants were anyone who had filed a prescription for any antiresorptive drug. The authors found a positive relationship between exposure to bisphosphonates and oesophageal cancer, with an OR of 1.74 (95% CI 1.19 to 2.55). An increased risk of oesophageal cancer was also found in the group exposed to bisphosphonates for a longer period of time. According to the authors, the results suggest a possible association between oral bisphosphonates and oesophageal cancer, and this risk is increased with a longer exposure period. An increased risk was observed for etidronic acid, but not alendronic acid.

Recently, Sun et al.124 undertook a a meta-analysis of observational studies. Seven epidemiological studies, four cohort studies and three case–control studies, were included and, where reported, alendronic acid was the main bisphosphonate. The underlying conditions for which patients were being treated with a bisphosphonate were not reported. In the primary analysis, bisphosphonate treatment was not associated with a risk of oesophageal cancer in either the cohort studies (pooled RR 1.23, 95% CI 0.79 to 1.92) or the case–control studies (pooled OR 1.24, 95% CI 0.98 to 1.57). The authors also observed no significant increased risk of oesophageal cancer in users of alendronic acid alone across cohort studies (RR 1.08, 95% CI 0.67 to 1.75) or across case–control studies (OR 1.16, 95% CI 0.82 to 1.63). They concluded that bisphosphonate treatment is not significantly associated with an excess risk of oesophageal cancer.

Atrial fibrillation

Loke et al.125 evaluated the risk of atrial fibrillation associated with biphosphonate use in patients with osteoporosis or fractures. RCTs of any biphosphonate compared with placebo and case–control and prospective or retrospective cohort studies in patients with osteoporosis that reported on the association between biphosphonate exposure and atrial fibrillation were eligible for inclusion. Interventions in the included RCTs included alendronic acid, risedronic acid and zoledronic acid. Interventions in the included case–control studies were mostly alendronic acid or etidronic acid. Across nine RCTs, biphosphonates significantly increased the risk of atrial fibrillation compared with placebo (OR 1.47, 95% CI 1.01 to 2.14). Biphosphonates did not significantly increase the risk of stroke or cardiovascular mortality (three RCTs). One case–control study found that patients with atrial fibrillation were more likely than control patients to have used biphosphonates (OR 1.86, 95% CI 1.09 to 3.15), but the second case–control study found no association. Neither study found a greater likelihood of current use of bisphosphonates among patients with atrial fibrillation. The authors concluded that bisphosphonates were associated with atrial fibrillation, but heterogeneity of the existing evidence and a paucity of information on some agents precluded any definitive conclusions with respect to risk.

Mortality

Only one review reported on mortality.116 The authors did not report an overall conclusion on this outcome, but did say that one cohort study found no difference in all-cause mortality, cancer mortality or mortality from cancer of the lung or GI tract between patients treated with risedronic acid and those treated with placebo. A non-statistically significant reduction in deaths from cardiovascular causes in the risedronic acid group was largely caused by a statistically significant reduction in stroke mortality in the combined risedronic acid groups (p = 0.015); and from one prescription event monitoring study that serious upper GI events included gastric, duodenal and peptic ulceration, gastritis, and duodenitis. However, only 9 of the 502 reported deaths for which the cause of death was established were attributed to GI causes.

Summary of reviews of adverse events

The 14 reviews were published from 2001 to 2014.112125 One review considered any antresorptive therapy,123 10 considered any bisphosphonate therapy112,114,117122,124,125 and three reported on AEs associated with specific bisphosphonates (two in risedronic acid113,115 and one in alendronic acid or risedronic acid116). Four reviews included evidence from both observational studies and RCTs112,116,117,125 and seven included only observational studies.118124 Five reviews reported on any AE,112115 whereas nine reported on specific AEs (four in jaw osteonecrosis,117120 two in atypical fracture,121,122 two in oesophogeal cancer123,124 and one in atrial fibrillation125). Four reviews pooled data across studies in a meta-analysis.120,122124

Evidence from these reviews indicates that rates of GI toxicity are similar following treatment with alendronic acid, risedronic acid, oral ibandronic acid and placebo. However, observational data suggest a high level of reporting of a number of conditions in the first month of therapy with alendronic acid or risedronic acid, particularly those affecting the upper GI tract. Zoledronic acid may be compromised by renal toxicity, and myalgia and arthralgia are evident in the acute phase following i.v. administration of the drug. Intravenous bisphosphonates, especially zoledronic acid, are more likely to predispose patients to osteonecrosis of the jaw, although absolute risk is very low. In addition to bisphosphonate use, there appears to be several other factors involved in the development of osteonecrosis of the jaw. There is an increased risk of atypical fracture among bisphosphonate users; however, events are rare and long-term bisphosphonate therapy is not a prerequisite for development of atypical fractures. Moreover, the use of glucocorticoids and proton pump inhibitors are important risk factors. Bisphosphonates are associated with serious atrial fibrillation, but heterogeneity of the existing evidence and a paucity of information on some agents preclude any definitive conclusions with respect to risk. The review evidence for the use of bisphosphonates and oesophogeal cancer is equivoval; no overlaps in this evidence either across the included reviews or with the RCT evidence base included in this assessment report were identified.

Continuance and concordance

Alendronic acid

Two trials reported that at the end of treatment (36 months) > 80% of participants were still taking study medication.55,64 One trial reported that > 60% of participants took 80% of their study medication.68

Ibandronic acid

The ARIBON74 trial reported that > 90% of participants took all of their monthly doses for 24 months. In the BONE trial,45 the mean duration on treatment was reported as 2.42 years in the placebo group and 2.48 years in the group receiving 2.5 mg per day of ibandronic acid.

Risedronic acid

Boonen et al.58 reported that, at 24 months, 91% of placebo and 98% of 35 mg per week of risedronic acid participants were compliant with the study drug. In the VERT-NA trial, Harris et al.70 reported that 55% of placebo and 60% of 5 mg per month risedronic acid groups completed 3 years of medication and Taxel et al.95 reported that compliance with the study drug was 90–95% for all participants.

Zoledronic acid versus alendronic acid

Hadji et al.106 reported that, in the ROSE trial, at 12 months, 80.9% of patients were compliant with alendronic acid therapy, but compliance with zoledronic acid was not reported.

Systematic review evidence for compliance and concordance

A supplementary search in MEDLINE (via Ovid) and EMBASE (via Ovid) for systematic reviews reporting on compliance and continuance was undertaken on 6 January 2015. Keywords for ‘compliance’ were combined with the named drug intervention terms and a reviews search filter. The MEDLINE search strategy is presented in Appendix 1. From this search, 57 additional citations were identified. These records were sifted by a single reviewer (MMSJ). Seven reviews were identified that summarised evidence for compliance and concordance across studies in bisphosphonates for osteoporosis and a summary of these reviews and their findings is presented in Appendix 6.116,127132

The review by Cramer et al.127 included studies reporting one measure of compliance or persistence derived from administrative databases of patient demographic and prescription information. Compliance was measured as the medication possession ratio (MPR) and persistence was measured as the number of days of possession without a gap in refills, and the percentage of patients persisting with therapy for 1 year. Most of the therapies in the 14 included studies obtained were oral daily or weekly bisphosphonates (alendronic acid and risedronic acid). Studies had observation periods of mainly 12 months. The reviewers reported that the mean MPR was consistently higher for weekly therapy (0.58–0.76) than for daily therapy (0.46–0.64). Patients receiving weekly bisphosphonates exhibited better persistence (length of persistence 194–269 days; 35.7–69.7% persistent) than those receiving daily therapy (length of persistence 134–208 days; 26.1–55.7% persistent). The reviewers concluded that, although patients using weekly bisphosphonate medication follow their prescribed regimens better than those using daily therapy, overall compliance and persistence rates were suboptimal.

Imaz et al.128 examined observational studies that prospectively analysed administrative databases of pharmacy refills for measures of persistence and compliance in patients who were prescribed either bisphosphonates (mainly alendronic acid and risedronic acid) or other anti-osteoporosis medications. Follow-up periods needed to be 1–2.5 years and compliance was to be measured by the MPR. Studies were pooled in meta-analyses, with 15 studies included in the review. The pooled persistence mean was 184.1 days (95% CI 163.9 to 204.3 days; five studies) and the pooled MPR mean was 66.9% (95% CI 63.3% to 70.5%; five studies) at the 1-year follow-up. Low compliance when compared with high compliance was significantly associated with increased overall fracture risk (RR 1.46, 95% CI 1.34 to 1.60; six studies) from 1 to 2.5 years after starting treatment. Compared with high compliance, low compliance was significantly associated with increased non-vertebral fracture risk (RR 1.16, 95% CI 1.07 to 1.26; three studies) from 1.9 to 2.2 years’ follow-up, increased hip fracture risk (RR 1.28, 95% CI 1.06 to 1.53; four studies) from 1.9 to 2.4 years’ follow-up and increased vertebral fracture risk (RR 1.43, 95% CI 1.26 to 1.63; two studies) from 2 to 2.2 years’ follow-up. The reviewers concluded that persistence and compliance were suboptimal for postmenopausal women who underwent bisphosphonate therapy for the treatment of osteoporosis.

Kothawala et al.129 reviewed 24 observational studies assessing pharmacological drug adherence in patients with osteoporosis. Among the included studies, bisphosphonates were the most frequently assessed drug. Treatment duration ranged from 1 month to > 24 months and a higher proportion of included patients were new users. However, the types of bisphosphonates were not reported. The outcomes of interest were grouped according to standardised definitions: persistence (how long a patient received therapy after initiating treatment), compliance (how correctly, in terms of dose and frequency, patients took their medication) and adherence (a combined measure of persistence and compliance). Outcome rates were pooled in a random-effects meta-analysis. Compliance data were extracted as the percentage of patients who reported that they followed the dosing recommendations. Adherence data were extracted as the percentage of patients who achieved a predefined MPR threshold. Across seven studies the pooled refill compliance rate was 68% at both 7–12 months (95% CI 63% to 72%) and at 13–24 months (95% CI 67% to 69%). The pooled estimate from self-reported data (four studies) was 62% (95% CI 48% to 75%) of patients following the recommended instructions within 6 months of starting treatment. Across six studies, the pooled estimate of patients achieving a MPR > 66% (one study) and > 80% (five studies) ranged from 53% (95% CI 52% to 54%) for treatment lasting 1–6 months to 43% (95% CI 32% to 54%) for treatment lasting 13–24 months. The authors concluded that one-third to one-half of patients being treated with pharmacological drugs for osteoporosis did not take their medication as directed.

Lee et al.130 reviewed 10 RCTs and observational studies. Compliance and persistence were evaluated, but data were not pooled. Studies in osteoporosis medications including alendronic acid were evaluated. These reviewers reported that adherence at 12 months was higher with weekly than with daily bisphosphonates (≥ 84% preference for weekly, MPR 60–76% vs. 46–64%; persistence 43.6–69.7% vs. 31.7–55.7%). The MPRs reported for oral bisphosphonates were 68–71% at 12 months. At 2 years, only 43% of patients had a MPR ≥ 80% for daily and weekly bisphosphonates. Observational studies (6–12 months’ duration) reported discontinuation rates of 18–22% for daily and 7% for weekly bisphosphonates. The studies suggested that patient prefer annual zoledronic acid infusions to weekly bisphosphonates (66.4–78.8% vs. 9.0–19.7%, respectively), but no data on compliance or persistence were available. The reviewers concluded that adherence is difficult to quantify and may not be exclusively influenced by the frequency of medication administration.

As part of a NICE report on AEs and persistence with oral bisphosphonates, Lloyd-Jones and Wilkinson116 reported that, across UK prescription event monitoring studies, 24.5% of patients prescribed alendronic acid by general practitioners (GPs) discontinued therapy within 1 year. The two most common reasons for stopping treatment were dyspeptic conditions (6.3%) and non-compliance (3.0%). These authors concluded that persistence might be improved by weekly rather than daily regimens.

Mikyas et al.131 reviewed treatment adherence in studies in male osteoporosis. Eighteen retrospective or prospective observational studies were included in the analysis. The reviewers reported that the definition and measure of medication adherence varied among studies; however, adherence was measured in terms of the MPR in most studies that reported adherence. The majority of treatments were bisphosphonates, of which the majority were alendronic acid; data were not pooled. Across studies, the percentage of males adherent to bisphosphonates [MPR > 0.8] over 12 months ranged from 32% to 64%. The reviewers concluded that one-third to two-thirds of men do not adhere to bisphosphonates.

Vieira et al.132 reviewed 27 mainly observational studies of bisphosphonates (alendronic acid, ibandronic acid, risedronic acid and zoledronic acid) covering a wide range of outcomes regarding adherence and associated factors. No data were pooled and a narrative summary of the included studies was reported. Among the included studies, the reviewers summarised evidence from one cohort study in which the proportion of days covered (described as equivalent of a MPR) was 82% with i.v. zoledronic acid and 58–62% with i.v. ibandronic acid; one cohort study in which overall compliance with oral alendronic acid, risedronic acid or ibandronic acid was 43%; one cohort study in which persistence with therapy declined from 63% at 1 year to 46% at 2 years and 12% at 9 years among patients receiving alendronic acid and risedronic acid; one RCT in which the MPR was 93–100% among women taking weekly alendronic acid or monthly ibandronic acid; and one retrospective observational study in women taking weekly (alendronic acid or risedronic acid) or monthly ibandronic acid. Patients treated with a monthly regimen were 37% less likely to be non-persistent and were more compliant, with a 5% higher absolute MPR, than women treated with weekly regimens; and one cohort study in patients taking weekly risedronic acid or weekly alendronic acid in which patients initiated on weekly oral generic alendronic acid showed a significantly lower persistence with bisphosphonate therapy than patients initiated on weekly oral branded risedronic acid and weekly oral branded alendronic acid. Across all studies, the reviewers concluded that a monthly dose is associated with better adherence than a weekly dose.

Summary of reviews of continuance and concordance

Seven reviews were identified, published between 2006 and 2014.116,127132 These are summarised in Appendix 6, Table 49. The majority of these reviews reported on aledronic acid and risedronic acid. One review also included studies in ibandronic acid132 and two included zoledronic acid.130,132 The majority of reviews evaluated compliance as a MPR and persistence measured as the number of days of possession. Data were pooled across studies by three reviews.128130

Evidence across these reviews indicates that although patients using weekly bisphosphonate medication follow their prescribed regimens better than those using daily therapy, overall compliance and persistence rates are suboptimal for postmenopausal women receiving bisphosphonate therapy for the treatment of osteoporosis. Furthermore, one-third to one-half of patients, including men being treated with bisphosphonates for osteoporosis, did not take their medication as directed. No overlaps in this evidence either across the included reviews or with the RCT evidence base included in this assessment report were identified.

Health-related quality of life

Alendronic acid

A quality-of-life assessment was reported by one RCT65 using the Nottingham Health Profile.133 Statistically significant improvements in all of the instrument’s domains were reported with alendronic acid. Differences between treatments with placebo were not reported.

Ibandronic acid

Health-related quality of life was not reported by any trial evaluating ibandronic acid.

Risedronic acid

Health-related quality of life was not reported by any trial evaluating risedronic acid.

Zoledronic acid

In the HORIZON-RFT trial, quality-of-life outcomes were reported by Adachi et al.103 Quality of life was assessed at 6, 12, 24 and 36 months using the EQ-5D VAS and utility scores.134 The authors report that, at the end of the study, mean change from baseline in EQ-5D VAS was greater (higher score better) in the zoledronic acid-treated group than in the placebo group (7.67 ± 0.56 vs. 5.42 ± 0.56; p = 0.0034). A statistically significant difference between treatments in EQ-5D VAS was also evident in the subgroup of patients experiencing clinical vertebral fractures (8.86 ± 4.91 vs. –1.69 ± 3.42; p = 0.0456), non-vertebral fractures (5.03 ± 2.48 vs. –1.07 ± 2.16; p = 0.0393) and clinical fractures (5.19 ± 2.25 vs. –0.72 ± 1.82; p = 0.0243) in favour of zoledronic acid. EQ-5D utility scores were comparable for zoledronic acid and placebo groups, but more participants in the placebo group consistently had extreme difficulty in mobility (1.74% vs. 2.13%; p = 0.6238), self-care (4.92% vs. 6.69%; p = 0.1013) and usual activities (10.28% vs. 12.91%; p = 0.0775).

Zoledronic acid versus alendronic acid

In the ROSE trial, Hadji et al.69 assessed quality of life using the quality of life questionnaire of the European Foundation for Osteoporosis questionnaire.135 Hadji et al.106 reported that in the alendronic acid group only the pain domain showed a significant improvement as compared with baseline. However, across all domains the differences between the treatments were not statistically significant.

Health resource use

Alendronic acid

The FIT I55 reported that the rate of hospital admissions for fracture was 9.2% in the placebo group, compared with 6.3% in the alendronic acid groups.

No other included RCT reported any hospitalisation and service use following fracture.

Systematic review evidence for health-related quality of life

A summary of reviews of HRQoL is presented in Chapter 4, Independent economic assessment.

Methods for the network meta-analyses

A NMA was conducted for each of the four main fracture types and for femoral neck BMD. Details of the statistical methods are provided in Appendix 3.

Selection of evidence contributing to the network meta-analysis

For RCTs to be eligible for inclusion in the NMA, the interventions were required to be assessed in line with the licensing indications. RCTs that included both licensed and unlicensed dose groups were included where outcome data for the licensed group could be isolated. RCTs that reported only results pooled across RCT groups were not included.

An assumption of the NMA is that RCTs are exchangeable, that is we would be prepared to treat any patient with any one of the treatments. Strictly, the RCTs included in this evidence synthesis are not exchangeable because not all of the treatments are licensed in all patient populations but the analysis follows the agreed scope.

Two RCTs reported that participants were switched from 5 mg per day alendronic acid to 10 mg per day alendronic acid after 24 months of the 36-month trial.55,64 A sensitivity analysis was performed to explore the impact on the results of excluding these RCTs from the analysis.

Vertebral fractures were assessed using either clinical/symptomatic (four RCTs56,77,81,89) or morphometric/radiographic (15 RCTs45,55,5860,6366,70,72,76,83,85,86) techniques, with two RCTs82,88 not stating the assessment method. A sensitivity analysis was performed to assess the impact on the results of including in the analysis those RCTs with only clinical assessment of fractures.

Femoral neck BMD data were presented either numerically or in graphical format. Nine RCTs55,56,64,68,72,76,85,87,90 presented results for each treatment group in graphical format but in the text presented the mean between-group differences in the percentage change in femoral neck BMD in numerical form. Two of the included RCTs45,77 reported only data on mean differences in percentage change between treatments. The remaining 24 RCTs presented sample estimates for each treatment group separately, with 20 reporting in numerical format53,57,59,62,63,65,66,70,73,75,7981,83,84,86,88,91,95 and four graphically.47,49,58,67 Where both formats were provided, numerical estimates were selected as the most accurate summaries of means and variances. Given potential inaccuracy and inconsistency between the numerical and graphical sample estimates, a sensitivity analysis was performed to explore the impact on the results of excluding the graphically extracted sample estimates from the analysis.

Results from the network meta-analyses

A summary of the data used in the NMA is provided in Tables 4246 in Appendix 3. The results for each of the four fracture types are presented in Vertebral fractures, class-effects model to wrist fractures, class-effects model. Results for femoral neck BMD are presented in Femoral neck bone mineral density, class-effects model. As described earlier (see Methods for the network meta-analyses), three sensitivity analyses were undertaken. Sensitivity analysis 1 is presented below (see Sensitivity analysis 1) and assesses the robustness of the results to the inclusion of RCTs that altered dose over the study duration. Sensitivity analysis 2, which considers clinically assessed vertebral fractures, is presented in Sensitivity analysis 2. Sensitivity analysis 3 is presented in Sensitivity analysis 3, excluding RCTs for which femoral neck BMD results were provided in graphical format only. Results using the standard random-effects model are presented in Appendix 3, Figures 131136.

Vertebral fractures, class-effects model

An NMA was used to compare the effects of alendronic acid, risedronic acid, zoledronic acid, 150 mg per month oral ibandronic acid and 2.5 mg per day oral ibandronic acid relative to placebo on the occurrence of vertebral fractures. Data were available from 21 RCTs,45,55,56,5860,6366,70,72,76,77,8183,85,86,88,89 each comparing two treatments. Figure 42 presents the network of evidence for vertebral fractures.

FIGURE 42. Vertebral fractures: network of evidence.

FIGURE 42

Vertebral fractures: network of evidence.

The network provided seven direct treatment comparisons (edges in the network diagram). For the placebo versus 2.5 mg per day oral ibandronic acid comparison there is no direct evidence. The risedronic acid versus alendronic acid comparison is contributed by one small study, with a zero count in the control arm. Three contrasts were checked for inconsistency between direct and indirect evidence. None of the comparisons showed significant evidence of inconsistency, as assessed using Bayesian p-values (Figure 43).

FIGURE 43. Vertebral fractures: class-effects model.

FIGURE 43

Vertebral fractures: class-effects model. Assessing inconsistency using node splitting. (a) Nodes 1 and 2, placebo–risedronic acid; (b) nodes 1–4, placebo–zoledronic acid; and (c) nodes 2–4, risedronic acid–zoledronic (more...)

Figure 44 presents the effects of each treatment relative to placebo, and the probabilities of treatment rankings are presented in Figure 45. The model fitted the data well, with a total residual deviance of 41.05 being close to the number of data points included in the analysis, which was 42. The deviance information criterion (DIC) was 69.28. The between-study SD was estimated to be 0.19 [95% credible interval (CrI) 0.01 to 0.49], implying mild heterogeneity in treatment effects between RCTs.

FIGURE 44. Vertebral fractures: class-effects model – HRs and 95% credible intervals.

FIGURE 44

Vertebral fractures: class-effects model – HRs and 95% credible intervals. Note that the mean effects estimates are plotted in black and predictive effects in a new study are plotted in green beneath. Points to the right of the line favour the (more...)

FIGURE 45. Vertebral fractures: class-effects model – probability of treatment rankings.

FIGURE 45

Vertebral fractures: class-effects model – probability of treatment rankings. (a) Placebo, mean rank = 5.99; (b) risedronic acid, mean rank = 3.89; (c) alendronic acid, mean rank = 2.91; (d) zoledronic acid, mean rank = 2.08; (more...)

The between-treatment SD was estimated to be 0.18 (95% CrI 0.01 to 0.86), which is indicative of mild heterogeneity in treatment effects between treatments (i.e. the effects of the bisphosphonates are relatively similar) but with considerable uncertainty.

All treatments were associated with beneficial treatment effects relative to placebo, and all treatment effects were statistically significant at a conventional 5% level. Zoledronic acid was associated with the greatest effect (HR 0.41, 95% CrI 0.28 to 0.56) and was most likely to be the most effective treatment (probability of 0.44 of being the most effective). Pairwise comparisons between treatments indicated that no active treatments are significantly more effective than other active treatments. The HR for a randomly chosen study for a new bisphosphonate is 0.45 (95% CrI 0.19 to 1.12), allowing for both between-study and between-treatment heterogeneity.

The effect of baseline risk as a potential treatment effect modifier was explored using metaregression. The model fitted the data well, with a total residual deviance of 41.11 (compared with 42 data points). The between-study SD was estimated to be 0.21 (95% CrI 0.02 to 0.57) and the between-treatment SD was estimated to be 0.18 (95% CrI to 0.01 to 0.92). The between-study SD from fitting a random-effects model to the placebo baseline data was 1.23 (95% CrI 0.86 to 1.90), indicating substantial heterogeneity between RCTs. However, there was no evidence that treatment effect varied according to baseline risk, with the interaction term estimated to be 0.02 (95% CrI –0.25 to 0.22). In fact, including baseline risk did not improve the fit of the model to the data according to a comparison of DICs (70.53 vs. 69.28), and actually increased the estimate of the between-study SD of the treatment effect. Exchangeable and related treatment–specific interactions were also considered. The model did not provide a better fit to the data, with a DIC of 71.50.

Non-vertebral fractures: class-effects model

An NMA was used to compare the effects of alendronic acid, risedronic acid, zoledronic acid, 150 mg per month of oral ibandronic acid and 2.5 mg per day of oral ibandronic acid relative to placebo on the occurrence of non-vertebral fractures. Data were available from 14 RCTs,45,5557,64,66,70,72,77,81,8385,89 each comparing two treatments. Figure 46 presents the network of evidence for non-vertebral fractures.

FIGURE 46. Non-vertebral fractures: network of evidence.

FIGURE 46

Non-vertebral fractures: network of evidence.

As the network provided no indirect evidence, an assessment of inconsistency was not performed. Figure 47 presents the effects of each treatment relative to placebo. The probabilities of treatment rankings are presented in Figure 48. The model fitted the data well, with a total residual deviance of 22.80 compared with the number of data points included in the analysis, which was 28. The DIC was 42.32. The between-study SD was estimated to be 0.08 (95% CrI 0.00 to 0.31), implying mild heterogeneity in treatment effects between RCTs.

FIGURE 47. Non-vertebral fractures: class-effects model – HRs and 95% CrIs.

FIGURE 47

Non-vertebral fractures: class-effects model – HRs and 95% CrIs. Note that the mean effect estimates are plotted in black; predictive effects in a new study are plotted in green beneath. Points to the right of the line favour the reference treatment (more...)

FIGURE 48. Non-vertebral fractures: class-effects model – probability of treatment rankings.

FIGURE 48

Non-vertebral fractures: class-effects model – probability of treatment rankings. Note that the most efficacious = 1, and the least efficacious = 6. (a) Placebo, mean rank = 5.52; (b) risedronic acid, mean (more...)

The between-treatment SD was estimated to be 0.17 (95% CrI 0.01 to 0.80), which is indicative of mild heterogeneity in treatment effects between treatments (i.e. the effects of the bisphosphonates are relatively similar) but with considerable uncertainty.

All treatments were associated with beneficial treatment effects relative to placebo, with risedronic acid, alendronic acid and zoledronic acid being statistically significant at a conventional 5% level. Risedronic acid was associated with the greatest effect (HR 0.72, 95% CrI 0.53 to 0.89) and was most likely to be the most effective treatment (with a probability of being the most effective of 0.46). No active treatments were statistically significantly more effective than other active treatment. The HR for a randomly chosen study for a new bisphosphonate is 0.79 (95% CrI 0.38 to 1.69), allowing for both between-study and between-treatment heterogeneity.

The effect of baseline risk as a potential treatment effect modifier was explored using metaregression. The model fitted the data well, with a total residual deviance of 23.65 (compared with 28 data points). The between-study SD was estimated to be 0.11 (95% CrI 0.01 to 0.37) and the between-treatment SD was estimated to be 0.17 (95% CrI 0.01 to 0.81). The between-study SD from fitting a random-effects model to the placebo baseline data was 0.48 (95% CrI 0.32 to 0.83), indicating moderate heterogeneity between RCTs. However, there was no evidence that treatment effect varied according to baseline risk, with the interaction term estimated to be –0.07 (95% CrI –0.44 to 0.22). In fact, including baseline risk did not improve the fit of the model to the data according to a comparison of DICs (44.27 vs. 44.32), and actually increased the estimate of the between-study SD of the treatment effect. Exchangeable and related treatment-specific interactions were also considered. The model did not provide a better fit to the data, with a DIC of 45.84.

Hip fractures: class-effects model

A NMA was used to compare the effects of alendronic acid, risedronic acid, zoledronic acid and 150 mg per month of oral ibandronic acid relative to placebo on the occurrence of hip fractures. Data were available from 10 RCTs,55,56,64,68,70,74,77,78,82,85 each comparing two treatments. Figure 49 presents the network of evidence for hip fractures.

FIGURE 49. Hip fractures: network of evidence.

FIGURE 49

Hip fractures: network of evidence. Owing to the limited power of indirect evidence, assessment for inconsistency was not performed.

Figure 50 presents the effects of each treatment relative to placebo. The probabilities of treatment rankings are presented in Figure 51. The model fitted the data well, with a total residual deviance of 18.46 (compared with the total number of data points included in the analysis of 18). The DIC was 33.82. The between-study SD was estimated to be 0.43 (95% CrI 0.23 to 0.74), implying moderate heterogeneity in treatment effects between RCTs.

FIGURE 50. Hip fractures: class-effects model – HRs and 95% CrIs.

FIGURE 50

Hip fractures: class-effects model – HRs and 95% CrIs. Note that the mean effect estimates are plotted in black; predictive effects in a new study are plotted in green beneath. Points to the right of the line favour the reference treatment (shown (more...)

FIGURE 51. Hip fractures: class-effects model.

FIGURE 51

Hip fractures: class-effects model. Probability of treatment rankings. Note that the most efficacious = 1 and the least efficacious = 6. (a) Placebo, mean rank = 3.97; (b) risedronic acid, mean rank = 2.5; (more...)

The between-treatment SD was estimated to be 0.19 (95% CrI 0.01 to 0.61), which is indicative of mild heterogeneity in treatment effects between treatments (i.e. the effects of the bisphosphonates are relatively similar) but with reasonable uncertainty.

All treatments were associated with beneficial treatment effects relative to placebo, although the treatment effects were not statistically significant at a conventional 5% level. Alendronic acid was associated with the greatest effect, with a HR of 0.79 (95% CrI 0.44 to 1.30) and was most likely to be the most effective treatment (probability 0.36 of being the most effective). The HR for a randomly chosen study for a new bisphosphonate is 0.85 (95% CrI 0.26 to 2.77).

The effect of baseline risk as a potential treatment effect modifier was explored using metaregression. For the model using standard reference priors there was evidence of poor convergence, and so weakly informative priors were used for placebo arms of two RCTs.74,82 The model fitted the data well, with a total residual deviance of 18.78 (compared with 18 data points). The between-study SD was estimated to be 0.40 (95% CrI 0.06 to 0.75) and the between-treatment SD was estimated to be 0.19 (95% CrI 0.01 to 0.63). The between-study SD from fitting a random-effects model to the placebo baseline data was 0.46 (95% CrI 0.23 to 1.05), indicating moderate heterogeneity between RCTs. However, there was no evidence that treatment effect varied according to baseline risk, with the interaction term estimated to be 0.43 (95% CrI –0.79 to 1.67). In fact, including baseline risk did not improve the fit of the model to the data according to a comparison of DICs (33.48 vs. 33.82), and actually increased the estimate of the between-study SD of the treatment effect. Exchangeable and related treatment-specific interactions were also considered but did not provide a better fit to the data.

Wrist fractures: class-effects model

A NMA was used to compare the effects of alendronic acid, risedronic acid, zoledronic acid and 150 mg per month of oral ibandronic acid relative to placebo on the occurrence of wrist fractures. Data were available from seven RCTs,55,64,70,74,80,82,85 each comparing two treatments. Figure 52 presents the network of evidence for wrist fractures.

FIGURE 52. Wrist fractures: network of evidence.

FIGURE 52

Wrist fractures: network of evidence.

Owing to the limited indirect evidence, an assessment for inconsistency was not performed. Figure 53 presents the effects of each treatment relative to placebo. The probabilities of treatment rankings are presented in Figure 54. The model fitted the data well, with a total residual deviance of 13.32 (compared with the total number of data points included in the analysis of 12). The DIC was 23.23. The between-study SD was estimated to be 0.28 (95% CrI 0.03 to 0.66), implying mild to moderate heterogeneity in treatment effects between RCTs.

FIGURE 53. Wrist fractures: class-effects model – HRs and 95% CrIs.

FIGURE 53

Wrist fractures: class-effects model – HRs and 95% CrIs. Note that the mean effect estimates are plotted in black; predictive effects in a new study are plotted in green beneath. Points to the right of the line favour the reference treatment (shown (more...)

FIGURE 54. Wrist fractures: class-effects model.

FIGURE 54

Wrist fractures: class-effects model. Probability of treatment rankings. Note that the most efficacious = 1 and the least efficacious = 6. (a) Placebo, mean rank = 3.44; (b) risedronic acid, mean rank = 1.9; (more...)

The between-treatment SD was estimated to be 0.17 (95% CrI 0.01 to 0.62), which is indicative of mild heterogeneity in treatment effects between treatments (i.e. the effects of the bisphosphonates are relatively similar) but with reasonable uncertainty.

All treatments were all associated with beneficial treatment effects relative to placebo, although the treatment effects were not statistically significant at a conventional 5% level. Risedronic acid was associated with the greatest effect, with a HR of 0.77 (95% CrI 0.39 to 1.28), and was most likely to be the most effective treatment (probability of 0.42 of being the most effective). No active treatment was statistically significantly more effective than another active treatment. The HR for a randomly chosen study for a new bisphosphonate was 0.81 (95% CrI 0.28 to 2.34).

The effect of baseline risk as a potential treatment effect modifier was explored using metaregression. For the model using standard reference priors there was evidence of poor convergence, and so weakly informative priors were used for placebo arms of two RCTs.79,82 The model fitted the data well, with a total residual deviance of 15.21 (compared with 12 data points). The between-study SD was estimated to be 0.35 (95% CrI 0.04 to 0.75) and the between-treatment SD was estimated to be 0.17 (95% CrI 0.01 to 0.61). The between-study SD from fitting a random-effects model to the placebo baseline data was 0.44 (95% CrI 0.12 to 1.52), indicating moderate heterogeneity between RCTs. However, there was no evidence that treatment effect varies according to baseline risk, with the interaction term estimated to be –0.40 (95% CrI –2.58 to 1.38). In fact, including baseline risk did not improve the fit of the model to the data according to a comparison of DICs (25.85 vs. 23.23), and actually increased the estimate of the between-study SD of the treatment effect. Exchangeable and related treatment-specific interactions were also considered, but did not provide a better fit to the data.

Femoral neck bone mineral density: class-effects model

An NMA was used to compare the effects of alendronic acid, risedronic acid, zoledronic acid, 2.5 mg per day of oral ibandronic acid, 150 mg per month of oral ibandronic acid and 3 mg every 3 months of i.v. ibandronic acid relative to placebo, on the percentage change in femoral neck BMD. Data were available from 35 RCTs,45,47,49,53,5559,6268,70,72,73,7577,7981,8388,9092,95 each comparing two treatments. An assessment of inconsistency between direct and indirect evidence is presented in Figure 55. The network provided 21 direct treatment comparisons (edges in the network diagram). For 12 of these comparisons there is no direct evidence, leaving nine treatment comparisons to assess for consistency.

FIGURE 55. Femoral neck BMD: class-effects model – assessing inconsistency using node splitting.

FIGURE 55

Femoral neck BMD: class-effects model – assessing inconsistency using node splitting. (a) Nodes 1 and 2, placebo–alendronic acid; (b) nodes 1–3, placebo–risedronic acid; (c) nodes 1–4, placebo–zoledronic (more...)

Figure 56 presents the network of evidence for femoral neck BMD. Nine RCTs55,56,64,68,72,76,85,87,90 presented summary statistics for each treatment group in graphical format while presenting the mean differences in percentage change in femoral neck BMD between treatments numerically in the text. A comparison of the numerical results and the graphically extracted results is presented in Figure 57, showing generally good but not identical correspondence between the two sample estimates.

FIGURE 56. Bone mineral density: network of evidence.

FIGURE 56

Bone mineral density: network of evidence.

FIGURE 57. Mean difference in percentage change in femoral neck BMD between treatments.

FIGURE 57

Mean difference in percentage change in femoral neck BMD between treatments. Comparison of reported vs. computed (from graph estimates) values.

An assessment of inconsistency between direct and indirect evidence is presented in Figure 55. The network provided 21 direct treatment comparisons (edges in the network diagram). For 12 of these comparisons there is no direct evidence, leaving nine treatment comparisons to assess for consistency.

Figure 58 presents the effects of each treatment relative to placebo on percentage change in femoral neck BMD. The probabilities of treatment rankings are presented in Figure 59. The model fitted the data well, with a total residual deviance of 53.65 (compared with the number of data points included in the analysis of 59). The DIC was 96.5. The between-study SD was estimated to be 0.53 (95% CrI 0.30 to 0.86), implying moderate heterogeneity in treatment effects between RCTs.

FIGURE 58. Femoral neck BMD: class-effects model – treatment effects and 95% CrIs.

FIGURE 58

Femoral neck BMD: class-effects model – treatment effects and 95% CrIs. Note that the mean effect estimates are plotted in black; predictive effects in a new study are plotted in green beneath. Points to the left of the line favour the reference (more...)

FIGURE 59. Femoral neck BMD: class-effects model.

FIGURE 59

Femoral neck BMD: class-effects model. Probability of treatment rankings. Note that the most efficacious = 1 and the least efficacious = 6. (a) alendronic acid, mean rank = 2.13; (b) risedronic acid, mean rank = 5.14; (more...)

The between-treatment SD was estimated to be 0.56 (95% CrI 0.19 to 1.70), which is indicative of moderate heterogeneity in treatment effects between RCTs (i.e. the effects of the bisphosphonates are more dissimilar) but with considerable uncertainty.

The estimated interaction term for duration of study, assuming a common interaction for each treatment, was 0.89 (95% CrI 0.48 to 1.18). The estimated interaction term implies that treatment effects increase with duration of study. Exchangeable and related treatment-specific interactions were also considered. The model did not provide a better fit to the data (DIC = 97.36).

All treatments were associated with a beneficial effect relative to placebo on percentage change in femoral neck BMD, and all treatment effects were statistically significant at a conventional 5% level. Zoledronic acid was associated with the greatest effect, with a treatment effect of 3.21 (95% CrI 2.52 to 3.86), and was most likely to be the most effective treatment (a probability of 0.48 of being the most effective). The treatment effect for a randomly chosen study for a new bisphosphonate is 2.79 (95% CrI 0.72 to 4.75), allowing for both between-study and between-treatment heterogeneity.

The sample mean ages of the participants in each study ranged from 50.5 to 78.5 years, with an overall mean of 64.1 years. The effect of age as a potential treatment effect modifier was explored using metaregression. The model fitted the data well, with a total residual deviance of 53.97 (compared with 59 data points). The DIC was 97.99, suggesting that including age as a covariate in the model did not improve the model fit. The between-study SD was estimated to be 0.55 (95% CrI 0.31 to 0.88), and the between-treatment SD was estimated to be 0.56 (95% CrI 0.18 to 1.73). The interaction term for study duration in this model was 0.86 (95% CrI 0.47 to 1.25). There was no evidence that treatment effect varied according to age, with the interaction term estimated to be 0.01 (95% CrI –0.04 to 0.06). A model in which the treatment effect modifier for age was treated as separate but related (i.e. exchangeable) for each treatment was fitted, but this did not improve the model fit, with a DIC of 98.86.

Of the 35 RCTs included in the network, six RCTs58,59,62,73,83,95 included only male participants, 26 only female participants45,47,49,53,5557,6368,70,72,75,76,7981,8487,90,92 and three included both.77,88,91 A metaregression was conducted to test for different treatment effects according to the proportion of male participants. In line with the licensing indications, interaction terms were not included for ibandronic acid treatments that are not licensed in men. The model fitted the data well, with a total residual deviance of 55.98 (compared with 59 data points). The between-study SD was estimated to be 0.51 (95% CrI 0.24 to 0.87). The between-treatment SD was estimated to be 0.45 (95% CrI 0.20 to 0.79) and the interaction term for study duration in this model was 0.81 (95% CrI 0.48 to 1.14). There was no evidence that treatment effect varied according to sex, with the interaction term estimated to be –0.79 (95% CrI –1.64 to 0.14). In fact, including sex did not improve the fit of the model to the data according to a comparison of DICs (98.24 vs. 96.5). Exchangeable and related treatment-specific interactions were also considered; the model did not provide a better fit to the data, with a DIC of 99.30.

The relationship between baseline response and treatment effect was also assessed. For the class-effects model with baseline response adjustment, there was evidence for poor convergence using standard reference priors, and so weakly informative priors were used for placebo arms of the RCTs with active treatment. The model fitted the data well, with a total residual deviance of 55.25 and DIC of 99.33. The between-study SD was estimated to be 0.51 (95% CrI 0.49 to 0.97) and the between-treatment SD was estimated to be 0.50 (95% CrI 0.19 to 1.38).

The between-study SD from fitting a random-effects model to the placebo baseline data was 1.05 (95% CrI 0.61 to 1.78). There was evidence of an interaction between baseline response and treatment effect, with the interaction term estimated to be –0.46 (95% CrI –0.76 to –0.13). Figure 57 presents the relationship between baseline response and treatment effect assuming a common interaction for each treatment. Including baseline response did not improve the fit of the model to the data according to a comparison of DICs, but did reduce the estimate of the between-study SD of the treatment effect. Exchangeable and related treatment-specific interactions were also considered. The model did not provide a better fit to the data, with a DIC of 100.43.

Sensitivity analysis 1

Sensitivity analysis 1 was conducted by excluding RCTs for which participants were switched from 5 mg per day of alendronic acid to 10 mg per day during the course of the study.55,64 This affected the networks for vertebral and non-vertebral outcomes only.

Sensitivity analysis 1: vertebral outcomes – class-effects model

A NMA was used to compare the effects of alendronic acid, risedronic acid, zoledronic acid, 150 mg per month of oral ibandronic acid and 2.5 mg per day of oral ibandronic acid relative to placebo on the occurrence of vertebral fractures. Data were available from 19 RCTs comparing two treatments.45,56,5860,63,65,66,70,72,76,77,8183,85,86,88,89 The network of evidence is the same as that presented in Figure 42, except for the exclusion of the two alendronic acid RCTs,55,64 so that the modified network contains only four direct estimates between placebo and alendronic acid rather than six. Figure 60 presents the effects of each treatment relative to placebo. The model fitted the data well, with a total residual deviance of 36.78 (compared with the total number of data points included in the analysis of 38). The between-study SD was estimated to be 0.23 (95% CrI 0.02 to 0.59) and the between-treatment SD was estimated to be 0.20 (95% CrI 0.01 to 0.96). On exclusion of the two RCTs,55,64 a treatment effect of 0.45 (95% CrI 0.28 to 0.68) was estimated for alendronic acid. The estimated treatment effect was the same as before, but with an increase in uncertainty.

FIGURE 60. Sensitivity 1: vertebral outcomes – class-effects model (HRs and 95% CrIs).

FIGURE 60

Sensitivity 1: vertebral outcomes – class-effects model (HRs and 95% CrIs). Note that the mean effect estimates are plotted in black; predictive effects in a new study are plotted in green beneath. Points to the right of the line favour the reference (more...)

Sensitivity analysis 1: non-vertebral outcomes

An NMA was used to compare the effects of alendronic acid, risedronic acid, zoledronic acid, 150 mg per month of oral ibandronic acid and 2.5 mg per day of oral ibandronic acid relative to placebo on the occurrence of non-vertebral fractures. Data were available from 12 RCTs comparing two treatments.45,56,57,66,70,72,77,81,8385,89 The network of evidence is the same as that presented in Figure 46, except for the exclusion of the two alendronic acid RCTs,55,64 so that the modified network contains only three direct estimates between placebo and alendronic acid rather than five. Figure 61 presents the effects of each treatment relative to placebo. The model fitted the data well, with a total residual deviance of 18.02 (compared with the total number of data points included in the analysis of 24). The between-study SD was estimated to be 0.10 (95% CrI 0.00 to 0.38) and the between-treatment SD was estimated to be 0.23 (95% CrI 0.01 to 1.00). On exclusion of the two RCTs,55,64 a more pronounced treatment effect of 0.68 (95% CrI 0.45 to 0.94) is observed for alendronic acid, compared with a value of 0.80 (95% CrI 0.65 to 0.94) estimated in the main analyses, Non-vertebral fractures: class-effects model, and there is an increase in uncertainty.

FIGURE 61. Sensitivity 1: non-vertebral outcomes – class-effects model (HRs and 95% CrIs).

FIGURE 61

Sensitivity 1: non-vertebral outcomes – class-effects model (HRs and 95% CrIs). Note that the mean effect estimates are plotted in black; predictive effects in a new study are plotted in green beneath. Points to the right of the line favour the (more...)

Sensitivity analysis 2

Sensitivity analysis 2 assessed vertebral fractures, including only the RCTs that used clinical/symptomatic assessment techniques. The network provides two comparisons for placebo against zoledronic acid and one comparison of placebo against risedronic acid.

Figure 62 presents the effects of each treatment relative to placebo. The model fitted the data well, with a total residual deviance of 6.32 being close to the six data points included in the analysis and a DIC of 11.68. The between-study SD was estimated to be 0.29 (95% CrI 0.02 to 0.72) and the between-treatment SD was estimated to be 0.18 (95% CrI 0.01 to 0.64). Both treatments are associated with beneficial treatment effects relative to placebo, significant at the 5% level. The HR for risedronic acid is 0.35 (95% CrI 0.17 to 0.72), compared with the HR of 0.50 (95% CrI 0.38 to 0.67) for all vertebral fractures. For zoledronic acid, the estimated HR is 0.34 (95% CrI 0.20 to 0.61), compared with 0.41 (95% CrI 0.28 to 0.56) for all vertebral fractures. No evidence was observed to suggest differential treatment effects according to assessment method.

FIGURE 62. Sensitivity 2: clinically assessed vertebral outcomes – class-effects model (HRs and 95% CrIs).

FIGURE 62

Sensitivity 2: clinically assessed vertebral outcomes – class-effects model (HRs and 95% CrIs).

Sensitivity analysis 3

Sensitivity analysis 3 assessed percentage change in femoral neck BMD, excluding the RCTs for which only graphically extracted results were available.47,49,58,67 An NMA was used to compare the effects of alendronic acid, risedronic acid, zoledronic acid, 2.5 mg per day of oral ibandronic acid and 150 mg per month of oral ibandronic acid relative to placebo on the percentage change in femoral neck BMD. Data were available from 31 RCTs,45,53,5557,59,62,66,68,70,72,73,7577,7981,8388,9092,95 each comparing two treatments. Figure 63 presents the network of evidence for femoral neck BMD.

FIGURE 63. Sensitivity analysis 3: femoral neck BMD excluding graphically extracted results – network of evidence.

FIGURE 63

Sensitivity analysis 3: femoral neck BMD excluding graphically extracted results – network of evidence.

Figure 64 presents the effects of each treatment relative to placebo. The model fitted the data well, with a total residual deviance of 46.41 (compared with the number of data points included in the analysis of 55). The DIC was 81.56. The between-study SD was estimated to be 0.43 (95% CrI 0.16 to 0.77), implying moderate heterogeneity in treatment effects between RCTs. The between-treatment SD was estimated to be 0.65 (95% CrI 0.15 to 2.81). The estimated interaction term for duration of study, assuming a common interaction for each treatment, was 0.86 (95% CrI 0.55 to 1.18).

FIGURE 64. Sensitivity analysis 3: femoral neck BMD excluding graphically extracted results – class-effects model [treatment effects (TEs) and 95% CrIs].

FIGURE 64

Sensitivity analysis 3: femoral neck BMD excluding graphically extracted results – class-effects model [treatment effects (TEs) and 95% CrIs]. Note that the mean effect estimates are plotted in black; predictive effects in a new study are plotted (more...)

All treatments were still associated with a beneficial effect relative to placebo, and all treatment effects were statistically significant at a conventional 5% level. As in the full NMA presented in Femoral neck bone mineral density: class-effects model, zoledronic acid was associated with the greatest effect, with a treatment effect of 3.37 (95% CrI 2.69 to 3.97).

Discussion

A total of 46 RCTs were identified that provided data for the clinical effectiveness systematic review.45,47,49,5395 Alendronic acid was evaluated against placebo in 17 RCTs,53,55,57,60,61,64,65,67,71,73,76,83,84,91,93,94,98 while 2.5 mg per day of oral ibandronic acid was evaluated against placebo in three RCTs45,47,49 and against 3 mg per 3 months of i.v. ibandronic acid in one RCT.49 Daily administration of 2.5 mg of oral ibandronic acid was compared with 150 mg per month oral administration in one RCT.47 risedronic acid was compared with placebo in 12 RCTs58,62,63,66,70,72,75,78,85,86,89,95 and zoledronic acid was compared with placebo in four RCTs.56,59,77,79 One RCT evaluated alendronic acid compared with 150 mg per month of oral ibandronic acid,81 five RCTs evaluated alendronic acid compared with risedronic acid,54,82,87,90,92 one RCT evaluated zoledronic acid compared with alendronic acid69 and one RCT evaluated zoledronic acid compared with risedronic acid.88 The maximum trial duration was 48 months.64

The risk of bias associated with the included RCTs was assessed using the Cochrane risk-of-bias instrument. Attrition ≥ 10% across treatment groups was evident for 29 (63%) of the included RCTs.45,47,49,56,58,59,63,66,69,70,73,76,7881,8385,89,91,93,94,111 Five trials were reported as either open label or single blind, and were considered at high risk of bias of performance bias.53,71,82,92,106 Blinded outcome assessment was reported by only 13 (28%) trials.55,56,59,64,68,70,76,77,83,8789,94

The outcome measures prespecified in the final NICE scope23 were addressed by the included trial evidence to varying degrees. Femoral neck BMD was the most widely reported outcome and fracture was the second most widely reported outcome. The majority of included trials reported AEs. Across the included trials there was limited reporting on outcomes of compliance (adherence and persistence), hospitalisation and service use, and quality of life.

A total of 27 RCTs provided suitable fracture data for inclusion in the fracture NMA:45,5559,61,6367,70,72,74,7678,8089 nine compared alendronic acid with placebo,55,57,61,64,65,67,76,83,84 two compared 150 mg per month of oral ibandronic acid with placebo,74,80 one compared 2.5 mg per day of oral ibandronic acid with placebo,45 nine compared risedronic acid with placebo,58,63,66,70,72,78,85,86,89 three compared zoledronic acid with placebo,56,59,77 one compared alendronic acid with risedronic acid;45 one compared 150 mg per month of oral ibandronic acid with alendronic acid82 and one compared zoledronic acid with risedronic acid.88

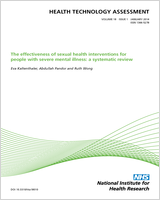
A total of 35 RCTs provided suitable femoral neck BMD data for inclusion in the BMD NMA: 45,47,49,53,5559,6268,70,72,73,7577,7981,8388,9092,95 12 evaluated alendronic acid compared with placebo,53,55,57,64,65,67,68,73,76,83,84,91 one evaluated 2.5 mg per day of oral ibandronic acid compared with placebo;45 one evaluated 150 mg per month of oral ibandronic acid compared with placebo;80 one evaluated 2.5 mg per day of oral ibandronic acid compared with 3 mg every 3 months of i.v. ibandronic acid;49 one evaluated 2.5 mg per day of oral ibandronic acid compared with 150 mg per month of oral ibandronic acid;47 10 evaluated risedronic acid compared with placebo;58,62,63,66,70,72,75,85,86,95 four evaluated zoledronic acid compared with placebo;56,57,77,79 three evaluated alendronic acid compared with risedronic acid;56,77,79 one evaluated alendronic acid compared with 150 mg per month of oral ibandronic acid;81 and one evaluated zoledronic acid compared with risedronic acid.88

Femoral neck BMD may be considered as a surrogate for fracture outcomes. Analysis of the femoral neck BMD data was of interest in order to confirm that the treatment effects were qualitatively the same. The analysis provided no evidence to suggest different treatment effects according to age or sex, with respect to percentage change in femoral neck BMD.

Based on the NMA, all treatments were associated with beneficial effects on each outcome measure relative to placebo. HRs for fracture varied from 0.41 to 0.92 depending on treatment and fracture site. All treatments resulted in statistically significant changes (at a conventional 5% level) in both vertebral fractures and percentage change in femoral neck BMD. Pairwise comparisons between treatments indicated that no active treatments were statistically significantly different from any other active treatment. For vertebral fractures and percentage change in femoral neck BMD, zoledronic acid had the greatest effect based on the midpoint estimates although in general the ranking of treatments varied for the different outcomes.

Assessment of vertebral fractures within the studies was based on both clinical and morphometric fractures. Ideally, the effect of assessment method would be assessed through metaregression; however, data for clinical fractures were limited. Consideration of the studies reporting clinical fractures did not provide any evidence to suggest different treatment effects according to assessment method.

The main analyses were based on a class-effects model such that the effects of each of the treatments are assumed to be related but not identical. The treatment effects estimated using the class-effects model were broadly similar qualitatively (i.e. direction of effect) and quantitatively (i.e. magnitude of effect) to those estimated using the standard random-effects model, but with the treatment effects in the class-effects model shrunk towards the overall bisphosphonate treatment effect. The qualitative effects of treatment (i.e. direction of effect) were the same for the majority of outcome types and treatments from the class effects and standard random-effects models with the exception of zoledronic acid (hip fractures), 150 mg per month of oral ibandronic acid (hip and wrist fractures) and 2.5 mg per day of oral ibandronic acid (non-vertebral fractures). Although the point estimates changed from being relative increases in effect in the standard random-effects model to relative decreases in effect in the class-effects model, there was considerable uncertainty about the true effects as reflected in the CrIs.

Non-vertebral fractures are used as a proxy for fractures of the proximal humerus, as fractures of the proximal humerus are not commonly reported. Two studies presented results for proximal humerus fractures, both considering the effects of risedronic acid against placebo.70,85 A standard random-effects meta-analysis of these two studies provided a HR of 0.45 (95% CrI 0.13 to 1.41), which was greater than that estimated for non-vertebral fractures from the standard random-effects NMA, (HR 0.65, 95% CrI 0.47 to 0.88), and from the class-effects NMA (HR 0.71, 95% CrI 0.52 to 0.89), but with considerably more uncertainty.

There were no statistically significant differences between treatments in the incidence of upper GI events associated with any oral bisphosphonate compared with placebo when data were pooled across RCTs for each bisphosphonate. However, evidence from one RCT indicated a statistically significant risk of upper GI events in men receiving risedronic acid compared with those treated with placebo.58 Where reported across the RCTs, treatments were prescribed in accordance with the SmPC for oral bisphosphonates to minimise gastric irritation. There was no evidence of significant differences between treatments in mortality across the RCT evidence when data were pooled by bisphosphonate. However, evidence from one RCT indicated that the proportion of men and women dying following hip fracture was significant higher in the placebo group than in the zoledronic acid group.77 There was also no evidence of significant between-treatment differences in participants withdrawing because of AEs across the RCT evidence when data were pooled by bisphosphonate. However, in one RCT the proportion of men withdrawing because of AEs was significantly higher in the alendronic acid group than in the placebo group.83

In agreement with the SmPC, there was evidence that zoledronic acid is associated with influenza-like symptoms . There was no statistically significant difference in the incidence of atrial fibrillation between those treated with zoledronic acid and those receiving placebo56,77 or risedronic acid.88 There was no statistically significant difference in the incidence of bone pain between those treated with zoledronic acid and those receiving placebo88 or alendronic acid.88 There was evidence that the risk of eye inflammation in the first 3 days following drug administration was significantly greater in those receiving zoledronic acid than in those receiving placebo.102 Evidence from a single RCT indicated that the incidence of stroke over 36 months does not differ significantly among individuals receiving zoledronic acid and those receiving placebo.77 All RCTs evaluating zoledronic acid reported no cases of spontaneous osteonecrosis of the jaw in any treatment group during the trial period.

Adverse events of hypocalcaemia and atypical femoral fracture were not reported as outcomes by any RCT of any bisphosphonate.

A summary of evidence from systematic reviews that include observational data indicates that alendronic acid, risedronic acid and oral ibandronic acid have similar rates of GI toxicity when compared with placebo. However, prescription event monitoring study data suggest a high level of reporting of a number of conditions in the first month of therapy with alendronic acid or risedronic acid, particularly those affecting the upper GI tract. Retrospective cohort data also suggest that switching patients who are stabilised on risedronic acid to alendronic acid is associated with an increased risk of GI AEs. Zoledronic acid may be compromised by renal toxicity, and myalgias and arthralgias are evident in the acute phase following i.v. administration. Intravenous bisphosphonates, especially zoledronic acid, are more likely to predispose patients to osteonecrosis of the jaw. However, in addition to bisphosphonate use, several other factors appear to be involved in the development of osteonecrosis of the jaw (e.g. dental trauma). There is an increased risk of atypical fracture among bisphosphonate users, but events are rare, and long-term bisphosphonate therapy might not be a prerequisite for development of atypical fractures. Moreover, the use of glucocorticoids and proton pump inhibitors is a potentially important risk factor for atypical fracture. Bisphosphonates are associated with serious atrial fibrillation, but heterogeneity of the existing evidence and a paucity of information on some agents preclude any definitive conclusions with respect to risk. The review evidence for the use of bisphosphonates and oesophogeal cancer is equivocal.

Evidence for persistence and adherence reported by RCTs was very limited. Where reported, high levels of compliance reported as a pill count were evident over the trial duration. A summary of evidence from systematic reviews including observational data indicates that, although patients using weekly bisphosphonate medication follow their prescribed regimens better than those using daily therapy, overall compliance and persistence rates are suboptimal for postmenopausal women receiving bisphosphonate therapy for the treatment of osteoporosis. Furthermore, one-third to one-half of patients, including men, being treated with bisphosphonates for osteoporosis do not take their medication as directed.

With the exception of the RCTs evaluating bisphosphonates in steroid users, the majority of RCTs included in the clinical effectiveness systematic review typically excluded people with underlying conditions that affect bone metabolism or people receiving medications that affect bone metabolism. Furthermore, people with history of, or receiving medication for, upper GI tract disorders were also excluded by the majority of included trials. Therefore, the effects of alendronic acid, ibandronic acid, risedronic acid and zoledronic acid are unknown in these populations.

Image 13-04-001-fig131
Image 13-04-001-fig136
Copyright © Queen’s Printer and Controller of HMSO 2016. This work was produced by Davis et al. under the terms of a commissioning contract issued by the Secretary of State for Health. This issue may be freely reproduced for the purposes of private research and study and extracts (or indeed, the full report) may be included in professional journals provided that suitable acknowledgement is made and the reproduction is not associated with any form of advertising. Applications for commercial reproduction should be addressed to: NIHR Journals Library, National Institute for Health Research, Evaluation, Trials and Studies Coordinating Centre, Alpha House, University of Southampton Science Park, Southampton SO16 7NS, UK.

Included under terms of UK Non-commercial Government License.

Bookshelf ID: NBK391002

Views

  • PubReader
  • Print View
  • Cite this Page
  • PDF version of this title (19M)

Other titles in this collection

Recent Activity

Your browsing activity is empty.

Activity recording is turned off.

Turn recording back on

See more...